A Look At The Fair Value Of Ashok Leyland Limited (NSE:ASHOKLEY)

Key Insights
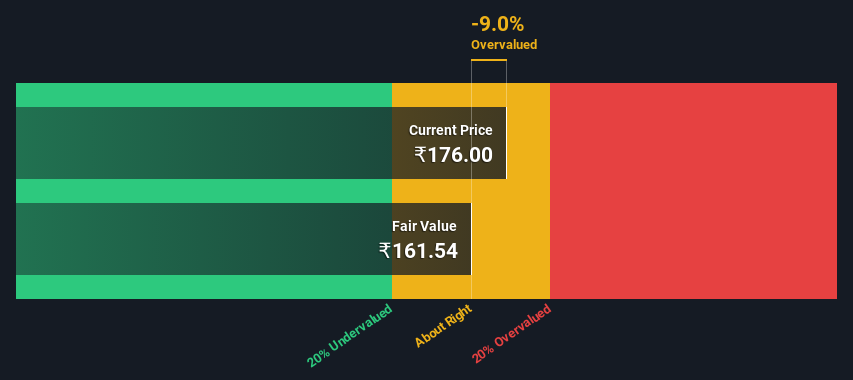
- Using the 2 Stage Free Cash Flow to Equity, Ashok Leyland fair value estimate is ₹162
- Current share price of ₹176 suggests Ashok Leyland is potentially trading close to its fair value
- The ₹202 analyst price target for ASHOKLEY is 25% more than our estimate of fair value
Today we will run through one way of estimating the intrinsic value of Ashok Leyland Limited (NSE:ASHOKLEY) by projecting its future cash flows and then discounting them to today's value. One way to achieve this is by employing the Discounted Cash Flow (DCF) model. There's really not all that much to it, even though it might appear quite complex.
Remember though, that there are many ways to estimate a company's value, and a DCF is just one method. If you want to learn more about discounted cash flow, the rationale behind this calculation can be read in detail in the Simply Wall St analysis model.
View our latest analysis for Ashok Leyland
The Method
We're using the 2-stage growth model, which simply means we take in account two stages of company's growth. In the initial period the company may have a higher growth rate and the second stage is usually assumed to have a stable growth rate. In the first stage we need to estimate the cash flows to the business over the next ten years. Where possible we use analyst estimates, but when these aren't available we extrapolate the previous free cash flow (FCF) from the last estimate or reported value. We assume companies with shrinking free cash flow will slow their rate of shrinkage, and that companies with growing free cash flow will see their growth rate slow, over this period. We do this to reflect that growth tends to slow more in the early years than it does in later years.
Generally we assume that a dollar today is more valuable than a dollar in the future, so we need to discount the sum of these future cash flows to arrive at a present value estimate:
10-year free cash flow (FCF) estimate
| 2024 | 2025 | 2026 | 2027 | 2028 | 2029 | 2030 | 2031 | 2032 | 2033 | |
| Levered FCF (₹, Millions) | ₹24.1b | ₹31.6b | ₹43.8b | ₹53.9b | ₹63.6b | ₹72.9b | ₹81.9b | ₹90.6b | ₹99.1b | ₹107.7b |
| Growth Rate Estimate Source | Analyst x14 | Analyst x16 | Analyst x15 | Est @ 22.96% | Est @ 18.08% | Est @ 14.67% | Est @ 12.28% | Est @ 10.61% | Est @ 9.44% | Est @ 8.62% |
| Present Value (₹, Millions) Discounted @ 17% | ₹20.6k | ₹22.9k | ₹27.2k | ₹28.5k | ₹28.7k | ₹28.0k | ₹26.8k | ₹25.3k | ₹23.6k | ₹21.9k |
("Est" = FCF growth rate estimated by Simply Wall St)
Present Value of 10-year Cash Flow (PVCF) = ₹253b
We now need to calculate the Terminal Value, which accounts for all the future cash flows after this ten year period. The Gordon Growth formula is used to calculate Terminal Value at a future annual growth rate equal to the 5-year average of the 10-year government bond yield of 6.7%. We discount the terminal cash flows to today's value at a cost of equity of 17%.
Terminal Value (TV)= FCF2033 × (1 + g) ÷ (r – g) = ₹108b× (1 + 6.7%) ÷ (17%– 6.7%) = ₹1.1t
Present Value of Terminal Value (PVTV)= TV / (1 + r)10= ₹1.1t÷ ( 1 + 17%)10= ₹221b
The total value, or equity value, is then the sum of the present value of the future cash flows, which in this case is ₹474b. The last step is to then divide the equity value by the number of shares outstanding. Relative to the current share price of ₹176, the company appears around fair value at the time of writing. The assumptions in any calculation have a big impact on the valuation, so it is better to view this as a rough estimate, not precise down to the last cent.
The Assumptions
The calculation above is very dependent on two assumptions. The first is the discount rate and the other is the cash flows. If you don't agree with these result, have a go at the calculation yourself and play with the assumptions. The DCF also does not consider the possible cyclicality of an industry, or a company's future capital requirements, so it does not give a full picture of a company's potential performance. Given that we are looking at Ashok Leyland as potential shareholders, the cost of equity is used as the discount rate, rather than the cost of capital (or weighted average cost of capital, WACC) which accounts for debt. In this calculation we've used 17%, which is based on a levered beta of 1.353. Beta is a measure of a stock's volatility, compared to the market as a whole. We get our beta from the industry average beta of globally comparable companies, with an imposed limit between 0.8 and 2.0, which is a reasonable range for a stable business.
SWOT Analysis for Ashok Leyland
- Earnings growth over the past year exceeded the industry.
- Debt is well covered by earnings.
- Dividend is in the top 25% of dividend payers in the market.
- No major weaknesses identified for ASHOKLEY.
- Annual earnings are forecast to grow for the next 4 years.
- Good value based on P/E ratio compared to estimated Fair P/E ratio.
- Debt is not well covered by operating cash flow.
- Paying a dividend but company has no free cash flows.
- Annual earnings are forecast to grow slower than the Indian market.
Looking Ahead:
Whilst important, the DCF calculation is only one of many factors that you need to assess for a company. It's not possible to obtain a foolproof valuation with a DCF model. Rather it should be seen as a guide to "what assumptions need to be true for this stock to be under/overvalued?" For example, changes in the company's cost of equity or the risk free rate can significantly impact the valuation. For Ashok Leyland, there are three further elements you should further examine:
- Risks: As an example, we've found 2 warning signs for Ashok Leyland (1 shouldn't be ignored!) that you need to consider before investing here.
- Future Earnings: How does ASHOKLEY's growth rate compare to its peers and the wider market? Dig deeper into the analyst consensus number for the upcoming years by interacting with our free analyst growth expectation chart.
- Other Solid Businesses: Low debt, high returns on equity and good past performance are fundamental to a strong business. Why not explore our interactive list of stocks with solid business fundamentals to see if there are other companies you may not have considered!
PS. Simply Wall St updates its DCF calculation for every Indian stock every day, so if you want to find the intrinsic value of any other stock just search here.
New: Manage All Your Stock Portfolios in One Place
We've created the ultimate portfolio companion for stock investors, and it's free.
• Connect an unlimited number of Portfolios and see your total in one currency
• Be alerted to new Warning Signs or Risks via email or mobile
• Track the Fair Value of your stocks
Have feedback on this article? Concerned about the content? Get in touch with us directly. Alternatively, email editorial-team (at) simplywallst.com.
This article by Simply Wall St is general in nature. We provide commentary based on historical data and analyst forecasts only using an unbiased methodology and our articles are not intended to be financial advice. It does not constitute a recommendation to buy or sell any stock, and does not take account of your objectives, or your financial situation. We aim to bring you long-term focused analysis driven by fundamental data. Note that our analysis may not factor in the latest price-sensitive company announcements or qualitative material. Simply Wall St has no position in any stocks mentioned.
About NSEI:ASHOKLEY
Ashok Leyland
Manufactures and sells commercial vehicles in India and internationally.
Good value average dividend payer.

