
Advertisement
- India
- /
- Construction
- /
- NSEI:ASHOKA
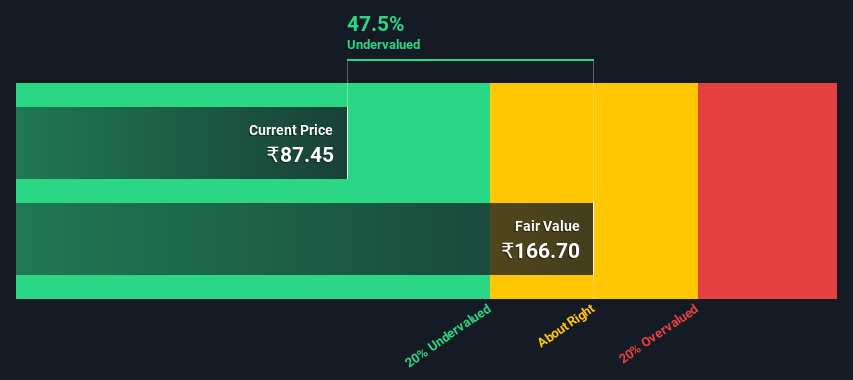
Is There An Opportunity With Ashoka Buildcon Limited's (NSE:ASHOKA) 48% Undervaluation?
Today we'll do a simple run through of a valuation method used to estimate the attractiveness of Ashoka Buildcon Limited (NSE:ASHOKA) as an investment opportunity by taking the expected future cash flows and discounting them to today's value. Our analysis will employ the Discounted Cash Flow (DCF) model. It may sound complicated, but actually it is quite simple!
We generally believe that a company's value is the present value of all of the cash it will generate in the future. However, a DCF is just one valuation metric among many, and it is not without flaws. If you still have some burning questions about this type of valuation, take a look at the Simply Wall St analysis model.
See our latest analysis for Ashoka Buildcon
The method
We're using the 2-stage growth model, which simply means we take in account two stages of company's growth. In the initial period the company may have a higher growth rate and the second stage is usually assumed to have a stable growth rate. To start off with, we need to estimate the next ten years of cash flows. Where possible we use analyst estimates, but when these aren't available we extrapolate the previous free cash flow (FCF) from the last estimate or reported value. We assume companies with shrinking free cash flow will slow their rate of shrinkage, and that companies with growing free cash flow will see their growth rate slow, over this period. We do this to reflect that growth tends to slow more in the early years than it does in later years.
Generally we assume that a dollar today is more valuable than a dollar in the future, and so the sum of these future cash flows is then discounted to today's value:
10-year free cash flow (FCF) estimate
| 2021 | 2022 | 2023 | 2024 | 2025 | 2026 | 2027 | 2028 | 2029 | 2030 | |
| Levered FCF (₹, Millions) | ₹880.0m | ₹7.33b | ₹7.24b | ₹8.15b | ₹9.04b | ₹9.91b | ₹10.8b | ₹11.7b | ₹12.6b | ₹13.5b |
| Growth Rate Estimate Source | Analyst x2 | Analyst x2 | Analyst x2 | Est @ 12.62% | Est @ 10.88% | Est @ 9.67% | Est @ 8.82% | Est @ 8.23% | Est @ 7.81% | Est @ 7.52% |
| Present Value (₹, Millions) Discounted @ 21% | ₹730 | ₹5.0k | ₹4.1k | ₹3.9k | ₹3.6k | ₹3.2k | ₹2.9k | ₹2.6k | ₹2.3k | ₹2.1k |
("Est" = FCF growth rate estimated by Simply Wall St)
Present Value of 10-year Cash Flow (PVCF) = ₹31b
After calculating the present value of future cash flows in the initial 10-year period, we need to calculate the Terminal Value, which accounts for all future cash flows beyond the first stage. The Gordon Growth formula is used to calculate Terminal Value at a future annual growth rate equal to the 5-year average of the 10-year government bond yield of 6.8%. We discount the terminal cash flows to today's value at a cost of equity of 21%.
Terminal Value (TV)= FCF2030 × (1 + g) ÷ (r – g) = ₹14b× (1 + 6.8%) ÷ (21%– 6.8%) = ₹106b
Present Value of Terminal Value (PVTV)= TV / (1 + r)10= ₹106b÷ ( 1 + 21%)10= ₹16b
The total value, or equity value, is then the sum of the present value of the future cash flows, which in this case is ₹47b. To get the intrinsic value per share, we divide this by the total number of shares outstanding. Relative to the current share price of ₹87.5, the company appears quite good value at a 48% discount to where the stock price trades currently. Valuations are imprecise instruments though, rather like a telescope - move a few degrees and end up in a different galaxy. Do keep this in mind.
Important assumptions
The calculation above is very dependent on two assumptions. The first is the discount rate and the other is the cash flows. Part of investing is coming up with your own evaluation of a company's future performance, so try the calculation yourself and check your own assumptions. The DCF also does not consider the possible cyclicality of an industry, or a company's future capital requirements, so it does not give a full picture of a company's potential performance. Given that we are looking at Ashoka Buildcon as potential shareholders, the cost of equity is used as the discount rate, rather than the cost of capital (or weighted average cost of capital, WACC) which accounts for debt. In this calculation we've used 21%, which is based on a levered beta of 2.000. Beta is a measure of a stock's volatility, compared to the market as a whole. We get our beta from the industry average beta of globally comparable companies, with an imposed limit between 0.8 and 2.0, which is a reasonable range for a stable business.
Looking Ahead:
Whilst important, the DCF calculation ideally won't be the sole piece of analysis you scrutinize for a company. DCF models are not the be-all and end-all of investment valuation. Rather it should be seen as a guide to "what assumptions need to be true for this stock to be under/overvalued?" If a company grows at a different rate, or if its cost of equity or risk free rate changes sharply, the output can look very different. Why is the intrinsic value higher than the current share price? For Ashoka Buildcon, there are three additional items you should look at:
- Risks: Every company has them, and we've spotted 3 warning signs for Ashoka Buildcon (of which 2 are concerning!) you should know about.
- Future Earnings: How does ASHOKA's growth rate compare to its peers and the wider market? Dig deeper into the analyst consensus number for the upcoming years by interacting with our free analyst growth expectation chart.
- Other Solid Businesses: Low debt, high returns on equity and good past performance are fundamental to a strong business. Why not explore our interactive list of stocks with solid business fundamentals to see if there are other companies you may not have considered!
PS. Simply Wall St updates its DCF calculation for every Indian stock every day, so if you want to find the intrinsic value of any other stock just search here.
If you’re looking to trade Ashoka Buildcon, open an account with the lowest-cost* platform trusted by professionals, Interactive Brokers. Their clients from over 200 countries and territories trade stocks, options, futures, forex, bonds and funds worldwide from a single integrated account. Promoted
New: Manage All Your Stock Portfolios in One Place
We've created the ultimate portfolio companion for stock investors, and it's free.
• Connect an unlimited number of Portfolios and see your total in one currency
• Be alerted to new Warning Signs or Risks via email or mobile
• Track the Fair Value of your stocks
This article by Simply Wall St is general in nature. It does not constitute a recommendation to buy or sell any stock, and does not take account of your objectives, or your financial situation. We aim to bring you long-term focused analysis driven by fundamental data. Note that our analysis may not factor in the latest price-sensitive company announcements or qualitative material. Simply Wall St has no position in any stocks mentioned.
*Interactive Brokers Rated Lowest Cost Broker by StockBrokers.com Annual Online Review 2020
Have feedback on this article? Concerned about the content? Get in touch with us directly. Alternatively, email editorial-team (at) simplywallst.com.
About NSEI:ASHOKA
Outstanding track record with excellent balance sheet.
Similar Companies
Market Insights

Advertisement
Community Narratives
Quality at a Premium. A time to watch, not to buy?
Fair Value US$154.56|30.1% undervalued
DA
Community Contributor
GRAB: The Super-App at the Heart of Southeast Asia’s Digital Boom
Fair Value US$8.20|25.6% undervalued
BL
Community Contributor
Verve Group to Surge with 51.61% Revenue Growth
Fair Value €6.00|63.2% undervalued
ME
Community Contributor