
Advertisement
- India
- /
- Auto Components
- /
- NSEI:TVSHLTD
TVS Holdings (NSE:TVSHLTD) stock performs better than its underlying earnings growth over last five years
Buying shares in the best businesses can build meaningful wealth for you and your family. While the best companies are hard to find, but they can generate massive returns over long periods. Don't believe it? Then look at the TVS Holdings Limited (NSE:TVSHLTD) share price. It's 351% higher than it was five years ago. And this is just one example of the epic gains achieved by some long term investors. It's also up 32% in about a month. This could be related to the recent financial results that were recently released - you could check the most recent data by reading our company report.
Since the stock has added ₹8.1b to its market cap in the past week alone, let's see if underlying performance has been driving long-term returns.
Check out our latest analysis for TVS Holdings
While markets are a powerful pricing mechanism, share prices reflect investor sentiment, not just underlying business performance. One way to examine how market sentiment has changed over time is to look at the interaction between a company's share price and its earnings per share (EPS).
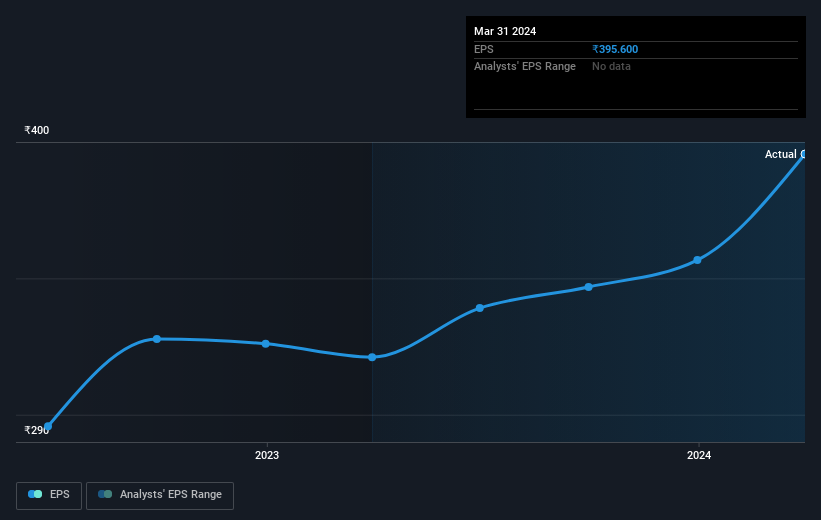
During five years of share price growth, TVS Holdings achieved compound earnings per share (EPS) growth of 13% per year. This EPS growth is slower than the share price growth of 35% per year, over the same period. This suggests that market participants hold the company in higher regard, these days. That's not necessarily surprising considering the five-year track record of earnings growth.
The graphic below depicts how EPS has changed over time (unveil the exact values by clicking on the image).
It might be well worthwhile taking a look at our free report on TVS Holdings' earnings, revenue and cash flow.
What About Dividends?
As well as measuring the share price return, investors should also consider the total shareholder return (TSR). The TSR is a return calculation that accounts for the value of cash dividends (assuming that any dividend received was reinvested) and the calculated value of any discounted capital raisings and spin-offs. It's fair to say that the TSR gives a more complete picture for stocks that pay a dividend. In the case of TVS Holdings, it has a TSR of 537% for the last 5 years. That exceeds its share price return that we previously mentioned. This is largely a result of its dividend payments!
A Different Perspective
We're pleased to report that TVS Holdings shareholders have received a total shareholder return of 258% over one year. And that does include the dividend. That gain is better than the annual TSR over five years, which is 45%. Therefore it seems like sentiment around the company has been positive lately. In the best case scenario, this may hint at some real business momentum, implying that now could be a great time to delve deeper. While it is well worth considering the different impacts that market conditions can have on the share price, there are other factors that are even more important. For example, we've discovered 2 warning signs for TVS Holdings (1 is a bit unpleasant!) that you should be aware of before investing here.
For those who like to find winning investments this free list of undervalued companies with recent insider purchasing, could be just the ticket.
Please note, the market returns quoted in this article reflect the market weighted average returns of stocks that currently trade on Indian exchanges.
Valuation is complex, but we're here to simplify it.
Discover if TVS Holdings might be undervalued or overvalued with our detailed analysis, featuring fair value estimates, potential risks, dividends, insider trades, and its financial condition.
Access Free AnalysisHave feedback on this article? Concerned about the content? Get in touch with us directly. Alternatively, email editorial-team (at) simplywallst.com.
This article by Simply Wall St is general in nature. We provide commentary based on historical data and analyst forecasts only using an unbiased methodology and our articles are not intended to be financial advice. It does not constitute a recommendation to buy or sell any stock, and does not take account of your objectives, or your financial situation. We aim to bring you long-term focused analysis driven by fundamental data. Note that our analysis may not factor in the latest price-sensitive company announcements or qualitative material. Simply Wall St has no position in any stocks mentioned.
About NSEI:TVSHLTD
TVS Holdings
Provides automotive vehicles and parts in India and internationally.
Solid track record, good value and pays a dividend.
Market Insights

Advertisement
Weekly Picks
FA

FAI on Arabian Internet and Communication Services ·
Solutions by stc: 34% Upside in Saudi's Digital Transformation Leader
Fair Value:ر.س342.2335.3% undervalued
9 followersusers have followed this narrative
1 commentusers have commented on this narrative
3 likesusers have liked this narrative
RO


RobertoAllende on NVIDIA ·
The AI Infrastructure Giant Grows Into Its Valuation
Fair Value:US$345.0747.9% undervalued
27 followersusers have followed this narrative
28 commentsusers have commented on this narrative
21 likesusers have liked this narrative
Recently Updated Narratives
TA


Talos on POET Technologies ·
The Hidden Gem of AI Hardware – Solving the Data Center Bottleneck
Fair Value:US$17.3773.5% undervalued
1 followerusers have followed this narrative
0 commentsusers have commented on this narrative
0 likesusers have liked this narrative
TA

Talos on Recursion Pharmaceuticals ·
Moving from "Science Fiction" to "Science Fact" – A Bullish Valuation Case
Fair Value:US$12.4965.1% undervalued
1 followerusers have followed this narrative
0 commentsusers have commented on this narrative
0 likesusers have liked this narrative
HA

Haha94 on Perdana Petroleum Berhad ·
Perdana Petroleum Berhad is a Zombie Business with a 27.34% Profit Margin and inflation adjusted revenue Business
Fair Value:RM 0.2128.6% undervalued
1 followerusers have followed this narrative
0 commentsusers have commented on this narrative
0 likesusers have liked this narrative
Popular Narratives
TH


TheWallstreetKing on MicroVision ·
MicroVision will explode future revenue by 380.37% with a vision towards success
Fair Value:US$6098.6% undervalued
109 followersusers have followed this narrative
11 commentsusers have commented on this narrative
22 likesusers have liked this narrative
AN

AnalystConsensusTarget on NVIDIA ·
NVDA: Expanding AI Demand Will Drive Major Data Center Investments Through 2026
Fair Value:US$250.3928.1% undervalued
943 followersusers have followed this narrative
6 commentsusers have commented on this narrative
24 likesusers have liked this narrative
OS


oscargarcia on Alphabet ·
The company that turned a verb into a global necessity and basically runs the modern internet, digital ads, smartphones, maps, and AI.
Fair Value:US$3407.4% undervalued
145 followersusers have followed this narrative
6 commentsusers have commented on this narrative
18 likesusers have liked this narrative