
Advertisement
- India
- /
- Auto Components
- /
- NSEI:MUNJALAU
Will Munjal Auto Industries (NSE:MUNJALAU) Multiply In Value Going Forward?
If we want to find a stock that could multiply over the long term, what are the underlying trends we should look for? Firstly, we'd want to identify a growing return on capital employed (ROCE) and then alongside that, an ever-increasing base of capital employed. If you see this, it typically means it's a company with a great business model and plenty of profitable reinvestment opportunities. However, after investigating Munjal Auto Industries (NSE:MUNJALAU), we don't think it's current trends fit the mold of a multi-bagger.
Return On Capital Employed (ROCE): What is it?
Just to clarify if you're unsure, ROCE is a metric for evaluating how much pre-tax income (in percentage terms) a company earns on the capital invested in its business. To calculate this metric for Munjal Auto Industries, this is the formula:
Return on Capital Employed = Earnings Before Interest and Tax (EBIT) ÷ (Total Assets - Current Liabilities)
0.0039 = ₹16m ÷ (₹10b - ₹6.1b) (Based on the trailing twelve months to September 2020).
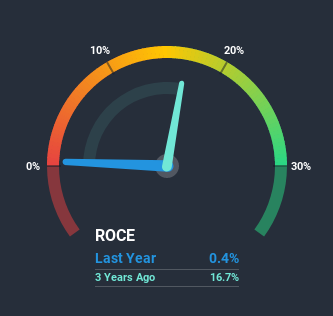
So, Munjal Auto Industries has an ROCE of 0.4%. In absolute terms, that's a low return and it also under-performs the Auto Components industry average of 6.9%.
Check out our latest analysis for Munjal Auto Industries
While the past is not representative of the future, it can be helpful to know how a company has performed historically, which is why we have this chart above. If you'd like to look at how Munjal Auto Industries has performed in the past in other metrics, you can view this free graph of past earnings, revenue and cash flow.
What Does the ROCE Trend For Munjal Auto Industries Tell Us?
In terms of Munjal Auto Industries' historical ROCE movements, the trend isn't fantastic. Over the last five years, returns on capital have decreased to 0.4% from 12% five years ago. Although, given both revenue and the amount of assets employed in the business have increased, it could suggest the company is investing in growth, and the extra capital has led to a short-term reduction in ROCE. And if the increased capital generates additional returns, the business, and thus shareholders, will benefit in the long run.
On a side note, Munjal Auto Industries' current liabilities have increased over the last five years to 59% of total assets, effectively distorting the ROCE to some degree. Without this increase, it's likely that ROCE would be even lower than 0.4%. And with current liabilities at these levels, suppliers or short-term creditors are effectively funding a large part of the business, which can introduce some risks.The Bottom Line
In summary, despite lower returns in the short term, we're encouraged to see that Munjal Auto Industries is reinvesting for growth and has higher sales as a result. These trends are starting to be recognized by investors since the stock has delivered a 38% gain to shareholders who've held over the last five years. Therefore we'd recommend looking further into this stock to confirm if it has the makings of a good investment.
One final note, you should learn about the 3 warning signs we've spotted with Munjal Auto Industries (including 2 which is can't be ignored) .
While Munjal Auto Industries isn't earning the highest return, check out this free list of companies that are earning high returns on equity with solid balance sheets.
If you’re looking to trade Munjal Auto Industries, open an account with the lowest-cost* platform trusted by professionals, Interactive Brokers. Their clients from over 200 countries and territories trade stocks, options, futures, forex, bonds and funds worldwide from a single integrated account. Promoted
New: Manage All Your Stock Portfolios in One Place
We've created the ultimate portfolio companion for stock investors, and it's free.
• Connect an unlimited number of Portfolios and see your total in one currency
• Be alerted to new Warning Signs or Risks via email or mobile
• Track the Fair Value of your stocks
This article by Simply Wall St is general in nature. It does not constitute a recommendation to buy or sell any stock, and does not take account of your objectives, or your financial situation. We aim to bring you long-term focused analysis driven by fundamental data. Note that our analysis may not factor in the latest price-sensitive company announcements or qualitative material. Simply Wall St has no position in any stocks mentioned.
*Interactive Brokers Rated Lowest Cost Broker by StockBrokers.com Annual Online Review 2020
Have feedback on this article? Concerned about the content? Get in touch with us directly. Alternatively, email editorial-team@simplywallst.com.
About NSEI:MUNJALAU
Munjal Auto Industries
Manufactures and sells auto components for motor vehicles in India.
Low risk and slightly overvalued.
Market Insights

Advertisement
Community Narratives
Quality at a Premium. A time to watch, not to buy?
Fair Value US$154.56|29.3% undervalued
DA
Community Contributor
GRAB: The Super-App at the Heart of Southeast Asia’s Digital Boom
Fair Value US$6.60|7.0% undervalued
BL
Community Contributor
Verve Group to Surge with 51.61% Revenue Growth
Fair Value €6.00|65.0% undervalued
ME
Community Contributor