- India
- /
- Auto Components
- /
- NSEI:MOTHERSON
Returns At Samvardhana Motherson International (NSE:MOTHERSON) Appear To Be Weighed Down


Finding a business that has the potential to grow substantially is not easy, but it is possible if we look at a few key financial metrics. One common approach is to try and find a company with returns on capital employed (ROCE) that are increasing, in conjunction with a growing amount of capital employed. If you see this, it typically means it's a company with a great business model and plenty of profitable reinvestment opportunities. So, when we ran our eye over Samvardhana Motherson International's (NSE:MOTHERSON) trend of ROCE, we liked what we saw.
What Is Return On Capital Employed (ROCE)?
If you haven't worked with ROCE before, it measures the 'return' (pre-tax profit) a company generates from capital employed in its business. The formula for this calculation on Samvardhana Motherson International is:
Return on Capital Employed = Earnings Before Interest and Tax (EBIT) ÷ (Total Assets - Current Liabilities)
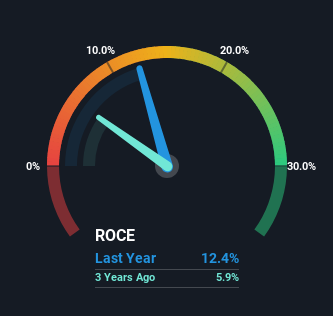
0.12 = ₹48b ÷ (₹782b - ₹392b) (Based on the trailing twelve months to December 2023).
Thus, Samvardhana Motherson International has an ROCE of 12%. That's a relatively normal return on capital, and it's around the 15% generated by the Auto Components industry.
View our latest analysis for Samvardhana Motherson International
In the above chart we have measured Samvardhana Motherson International's prior ROCE against its prior performance, but the future is arguably more important. If you're interested, you can view the analysts predictions in our free analyst report for Samvardhana Motherson International .
What Does the ROCE Trend For Samvardhana Motherson International Tell Us?
The trend of ROCE doesn't stand out much, but returns on a whole are decent. The company has employed 53% more capital in the last five years, and the returns on that capital have remained stable at 12%. Since 12% is a moderate ROCE though, it's good to see a business can continue to reinvest at these decent rates of return. Over long periods of time, returns like these might not be too exciting, but with consistency they can pay off in terms of share price returns.
Another thing to note, Samvardhana Motherson International has a high ratio of current liabilities to total assets of 50%. This can bring about some risks because the company is basically operating with a rather large reliance on its suppliers or other sorts of short-term creditors. While it's not necessarily a bad thing, it can be beneficial if this ratio is lower.
The Bottom Line
The main thing to remember is that Samvardhana Motherson International has proven its ability to continually reinvest at respectable rates of return. And since the stock has risen strongly over the last five years, it appears the market might expect this trend to continue. So while investors seem to be recognizing these promising trends, we still believe the stock deserves further research.
Like most companies, Samvardhana Motherson International does come with some risks, and we've found 3 warning signs that you should be aware of.
For those who like to invest in solid companies, check out this free list of companies with solid balance sheets and high returns on equity.
New: Manage All Your Stock Portfolios in One Place
We've created the ultimate portfolio companion for stock investors, and it's free.
• Connect an unlimited number of Portfolios and see your total in one currency
• Be alerted to new Warning Signs or Risks via email or mobile
• Track the Fair Value of your stocks
Have feedback on this article? Concerned about the content? Get in touch with us directly. Alternatively, email editorial-team (at) simplywallst.com.
This article by Simply Wall St is general in nature. We provide commentary based on historical data and analyst forecasts only using an unbiased methodology and our articles are not intended to be financial advice. It does not constitute a recommendation to buy or sell any stock, and does not take account of your objectives, or your financial situation. We aim to bring you long-term focused analysis driven by fundamental data. Note that our analysis may not factor in the latest price-sensitive company announcements or qualitative material. Simply Wall St has no position in any stocks mentioned.
About NSEI:MOTHERSON
Samvardhana Motherson International
Engages in the development, manufacture, supply, and sale of components for automotive original equipment manufacturers in India, Germany, the United States, and internationally.
Flawless balance sheet with solid track record and pays a dividend.
Market Insights

Community Narratives

