
Advertisement
- Israel
- /
- Renewable Energy
- /
- TASE:OPCE
Even though OPC Energy (TLV:OPCE) has lost ₪259m market cap in last 7 days, shareholders are still up 112% over 3 years
One simple way to benefit from the stock market is to buy an index fund. But if you pick the right individual stocks, you could make more than that. For example, OPC Energy Ltd. (TLV:OPCE) shareholders have seen the share price rise 68% over three years, well in excess of the market return (48%, not including dividends). On the other hand, the returns haven't been quite so good recently, with shareholders up just 21% , including dividends .
In light of the stock dropping 3.8% in the past week, we want to investigate the longer term story, and see if fundamentals have been the driver of the company's positive three-year return.
See our latest analysis for OPC Energy
To paraphrase Benjamin Graham: Over the short term the market is a voting machine, but over the long term it's a weighing machine. One way to examine how market sentiment has changed over time is to look at the interaction between a company's share price and its earnings per share (EPS).
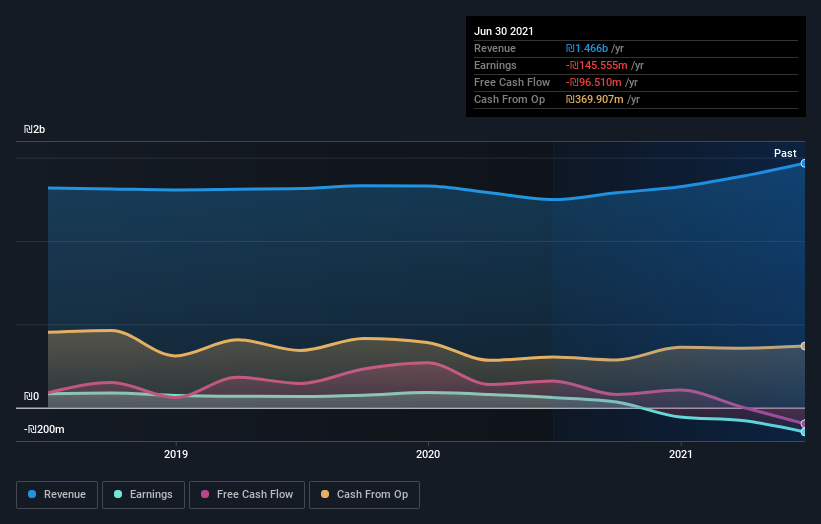
During the three years of share price growth, OPC Energy actually saw its earnings per share (EPS) drop 78% per year.
This means it's unlikely the market is judging the company based on earnings growth. Since the change in EPS doesn't seem to correlate with the change in share price, it's worth taking a look at other metrics.
We severely doubt anyone is particularly impressed with the modest 1.8% three-year revenue growth rate. So truth be told we can't see an easy explanation for the share price action, but perhaps you can...
You can see below how earnings and revenue have changed over time (discover the exact values by clicking on the image).
Balance sheet strength is crucial. It might be well worthwhile taking a look at our free report on how its financial position has changed over time.
What about the Total Shareholder Return (TSR)?
Investors should note that there's a difference between OPC Energy's total shareholder return (TSR) and its share price change, which we've covered above. Arguably the TSR is a more complete return calculation because it accounts for the value of dividends (as if they were reinvested), along with the hypothetical value of any discounted capital that have been offered to shareholders. OPC Energy hasn't been paying dividends, but its TSR of 112% exceeds its share price return of 68%, implying it has either spun-off a business, or raised capital at a discount; thereby providing additional value to shareholders.
A Different Perspective
OPC Energy shareholders are up 21% for the year. It's always nice to make money but this return falls short of the market return which was about 47% for the year. But the (superior) three-year TSR of 28% per year is some consolation. We prefer focus on longer term returns, as they are usually a more meaningful indication of the underlying business. It's always interesting to track share price performance over the longer term. But to understand OPC Energy better, we need to consider many other factors. Take risks, for example - OPC Energy has 3 warning signs (and 2 which are a bit unpleasant) we think you should know about.
We will like OPC Energy better if we see some big insider buys. While we wait, check out this free list of growing companies with considerable, recent, insider buying.
Please note, the market returns quoted in this article reflect the market weighted average returns of stocks that currently trade on IL exchanges.
New: AI Stock Screener & Alerts
Our new AI Stock Screener scans the market every day to uncover opportunities.
• Dividend Powerhouses (3%+ Yield)
• Undervalued Small Caps with Insider Buying
• High growth Tech and AI Companies
Or build your own from over 50 metrics.
Have feedback on this article? Concerned about the content? Get in touch with us directly. Alternatively, email editorial-team (at) simplywallst.com.
This article by Simply Wall St is general in nature. We provide commentary based on historical data and analyst forecasts only using an unbiased methodology and our articles are not intended to be financial advice. It does not constitute a recommendation to buy or sell any stock, and does not take account of your objectives, or your financial situation. We aim to bring you long-term focused analysis driven by fundamental data. Note that our analysis may not factor in the latest price-sensitive company announcements or qualitative material. Simply Wall St has no position in any stocks mentioned.
About TASE:OPCE
OPC Energy
Engages in the development, construction, operation, generation, and supply of electricity in Israel.
Solid track record with mediocre balance sheet.
Similar Companies
Market Insights

Advertisement
Community Narratives
MicroVision will explode future revenue by 380.37% with a vision towards success
Fair Value US$60.00|98.4% undervalued
TH
Community Contributor
The Indispensable Artery for a New North American Economy
Fair Value CA$132.87|1.3% undervalued
TI
Community Contributor