
Advertisement
- Israel
- /
- Tech Hardware
- /
- TASE:CLAB
Is Weakness In C-Lab Ltd (TLV:CLAB) Stock A Sign That The Market Could be Wrong Given Its Strong Financial Prospects?

With its stock down 32% over the past week, it is easy to disregard C-Lab (TLV:CLAB). But if you pay close attention, you might gather that its strong financials could mean that the stock could potentially see an increase in value in the long-term, given how markets usually reward companies with good financial health. Specifically, we decided to study C-Lab's ROE in this article.
Return on equity or ROE is a key measure used to assess how efficiently a company's management is utilizing the company's capital. Put another way, it reveals the company's success at turning shareholder investments into profits.
Check out our latest analysis for C-Lab
How Is ROE Calculated?
The formula for return on equity is:
Return on Equity = Net Profit (from continuing operations) ÷ Shareholders' Equity
So, based on the above formula, the ROE for C-Lab is:
25% = ₪21m ÷ ₪83m (Based on the trailing twelve months to December 2023).
The 'return' refers to a company's earnings over the last year. That means that for every ₪1 worth of shareholders' equity, the company generated ₪0.25 in profit.
What Has ROE Got To Do With Earnings Growth?
So far, we've learned that ROE is a measure of a company's profitability. We now need to evaluate how much profit the company reinvests or "retains" for future growth which then gives us an idea about the growth potential of the company. Assuming everything else remains unchanged, the higher the ROE and profit retention, the higher the growth rate of a company compared to companies that don't necessarily bear these characteristics.
C-Lab's Earnings Growth And 25% ROE
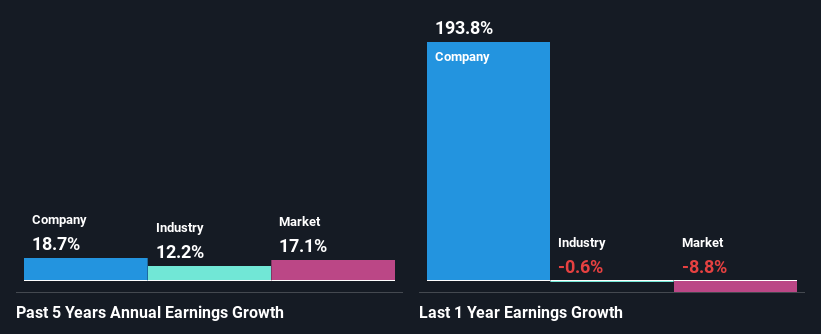
Firstly, we acknowledge that C-Lab has a significantly high ROE. Additionally, the company's ROE is higher compared to the industry average of 9.5% which is quite remarkable. This probably laid the groundwork for C-Lab's moderate 19% net income growth seen over the past five years.
As a next step, we compared C-Lab's net income growth with the industry, and pleasingly, we found that the growth seen by the company is higher than the average industry growth of 12%.
The basis for attaching value to a company is, to a great extent, tied to its earnings growth. The investor should try to establish if the expected growth or decline in earnings, whichever the case may be, is priced in. This then helps them determine if the stock is placed for a bright or bleak future. One good indicator of expected earnings growth is the P/E ratio which determines the price the market is willing to pay for a stock based on its earnings prospects. So, you may want to check if C-Lab is trading on a high P/E or a low P/E, relative to its industry.
Is C-Lab Making Efficient Use Of Its Profits?
C-Lab doesn't pay any regular dividends currently which essentially means that it has been reinvesting all of its profits into the business. This definitely contributes to the decent earnings growth number that we discussed above.
Summary
Overall, we are quite pleased with C-Lab's performance. In particular, it's great to see that the company is investing heavily into its business and along with a high rate of return, that has resulted in a sizeable growth in its earnings. If the company continues to grow its earnings the way it has, that could have a positive impact on its share price given how earnings per share influence long-term share prices. Let's not forget, business risk is also one of the factors that affects the price of the stock. So this is also an important area that investors need to pay attention to before making a decision on any business. You can see the 3 risks we have identified for C-Lab by visiting our risks dashboard for free on our platform here.
New: AI Stock Screener & Alerts
Our new AI Stock Screener scans the market every day to uncover opportunities.
• Dividend Powerhouses (3%+ Yield)
• Undervalued Small Caps with Insider Buying
• High growth Tech and AI Companies
Or build your own from over 50 metrics.
Have feedback on this article? Concerned about the content? Get in touch with us directly. Alternatively, email editorial-team (at) simplywallst.com.
This article by Simply Wall St is general in nature. We provide commentary based on historical data and analyst forecasts only using an unbiased methodology and our articles are not intended to be financial advice. It does not constitute a recommendation to buy or sell any stock, and does not take account of your objectives, or your financial situation. We aim to bring you long-term focused analysis driven by fundamental data. Note that our analysis may not factor in the latest price-sensitive company announcements or qualitative material. Simply Wall St has no position in any stocks mentioned.
About TASE:CLAB
C-Lab
Manufactures and sells ARM-based computer-on-module and system-on-module products worldwide.
Flawless balance sheet and slightly overvalued.
Market Insights

Advertisement
Community Narratives

BMW cruising ahead with new EVs and premium models to boost revenue 5%
Fair Value €135.07|44.6% undervalued
UN
Community Contributor
EU#2 - From Humble Beginnings to Global Powerhouse
Fair Value DKK 851.04|46.4% undervalued
TO
Community Contributor