- Israel
- /
- Real Estate
- /
- TASE:AURA
While shareholders of Aura Investments (TLV:AURA) are in the black over 5 years, those who bought a week ago aren't so fortunate


For many, the main point of investing in the stock market is to achieve spectacular returns. And we've seen some truly amazing gains over the years. For example, the Aura Investments Ltd. (TLV:AURA) share price is up a whopping 554% in the last half decade, a handsome return for long term holders. If that doesn't get you thinking about long term investing, we don't know what will. It's also good to see the share price up 32% over the last quarter. The company reported its financial results recently; you can catch up on the latest numbers by reading our company report. Anyone who held for that rewarding ride would probably be keen to talk about it.
Since the long term performance has been good but there's been a recent pullback of 6.2%, let's check if the fundamentals match the share price.
View our latest analysis for Aura Investments
While the efficient markets hypothesis continues to be taught by some, it has been proven that markets are over-reactive dynamic systems, and investors are not always rational. One flawed but reasonable way to assess how sentiment around a company has changed is to compare the earnings per share (EPS) with the share price.
During the last half decade, Aura Investments became profitable. That kind of transition can be an inflection point that justifies a strong share price gain, just as we have seen here. Given that the company made a profit three years ago, but not five years ago, it is worth looking at the share price returns over the last three years, too. Indeed, the Aura Investments share price has gained 276% in three years. During the same period, EPS grew by 55% each year. This EPS growth is remarkably close to the 55% average annual increase in the share price (over three years, again). That suggests that the market sentiment around the company hasn't changed much over that time. There's a strong correlation between the share price and EPS.
You can see below how EPS has changed over time (discover the exact values by clicking on the image).
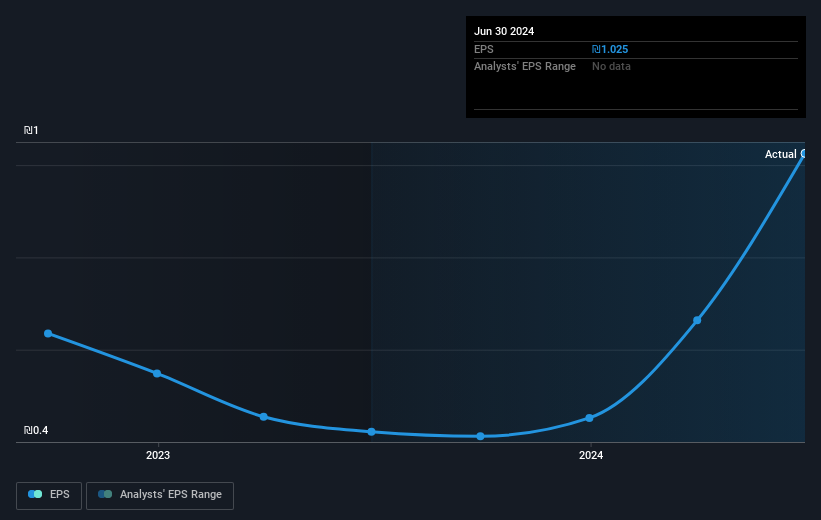
Dive deeper into Aura Investments' key metrics by checking this interactive graph of Aura Investments's earnings, revenue and cash flow.
What About Dividends?
As well as measuring the share price return, investors should also consider the total shareholder return (TSR). The TSR is a return calculation that accounts for the value of cash dividends (assuming that any dividend received was reinvested) and the calculated value of any discounted capital raisings and spin-offs. Arguably, the TSR gives a more comprehensive picture of the return generated by a stock. In the case of Aura Investments, it has a TSR of 608% for the last 5 years. That exceeds its share price return that we previously mentioned. And there's no prize for guessing that the dividend payments largely explain the divergence!
A Different Perspective
We're pleased to report that Aura Investments shareholders have received a total shareholder return of 74% over one year. Of course, that includes the dividend. That gain is better than the annual TSR over five years, which is 48%. Therefore it seems like sentiment around the company has been positive lately. In the best case scenario, this may hint at some real business momentum, implying that now could be a great time to delve deeper. While it is well worth considering the different impacts that market conditions can have on the share price, there are other factors that are even more important. Consider for instance, the ever-present spectre of investment risk. We've identified 4 warning signs with Aura Investments (at least 2 which make us uncomfortable) , and understanding them should be part of your investment process.
If you like to buy stocks alongside management, then you might just love this free list of companies. (Hint: many of them are unnoticed AND have attractive valuation).
Please note, the market returns quoted in this article reflect the market weighted average returns of stocks that currently trade on Israeli exchanges.
New: Manage All Your Stock Portfolios in One Place
We've created the ultimate portfolio companion for stock investors, and it's free.
• Connect an unlimited number of Portfolios and see your total in one currency
• Be alerted to new Warning Signs or Risks via email or mobile
• Track the Fair Value of your stocks
Have feedback on this article? Concerned about the content? Get in touch with us directly. Alternatively, email editorial-team (at) simplywallst.com.
This article by Simply Wall St is general in nature. We provide commentary based on historical data and analyst forecasts only using an unbiased methodology and our articles are not intended to be financial advice. It does not constitute a recommendation to buy or sell any stock, and does not take account of your objectives, or your financial situation. We aim to bring you long-term focused analysis driven by fundamental data. Note that our analysis may not factor in the latest price-sensitive company announcements or qualitative material. Simply Wall St has no position in any stocks mentioned.
About TASE:AURA
Aura Investments
Together with its subsidiaries engages in locating, initiating, planning, and building projects in the field of residential real estate in Israel and internationally.
Proven track record with mediocre balance sheet.

