
Advertisement
Rimoni Industries Ltd. (TLV:RIMO) Is Going Strong But Fundamentals Appear To Be Mixed : Is There A Clear Direction For The Stock?

Most readers would already be aware that Rimoni Industries' (TLV:RIMO) stock increased significantly by 16% over the past month. But the company's key financial indicators appear to be differing across the board and that makes us question whether or not the company's current share price momentum can be maintained. Particularly, we will be paying attention to Rimoni Industries' ROE today.
Return on Equity or ROE is a test of how effectively a company is growing its value and managing investors’ money. In short, ROE shows the profit each dollar generates with respect to its shareholder investments.
Check out our latest analysis for Rimoni Industries
How To Calculate Return On Equity?
The formula for return on equity is:
Return on Equity = Net Profit (from continuing operations) ÷ Shareholders' Equity
So, based on the above formula, the ROE for Rimoni Industries is:
24% = ₪41m ÷ ₪171m (Based on the trailing twelve months to June 2023).
The 'return' refers to a company's earnings over the last year. So, this means that for every ₪1 of its shareholder's investments, the company generates a profit of ₪0.24.
What Has ROE Got To Do With Earnings Growth?
Thus far, we have learned that ROE measures how efficiently a company is generating its profits. Depending on how much of these profits the company reinvests or "retains", and how effectively it does so, we are then able to assess a company’s earnings growth potential. Assuming all else is equal, companies that have both a higher return on equity and higher profit retention are usually the ones that have a higher growth rate when compared to companies that don't have the same features.
Rimoni Industries' Earnings Growth And 24% ROE
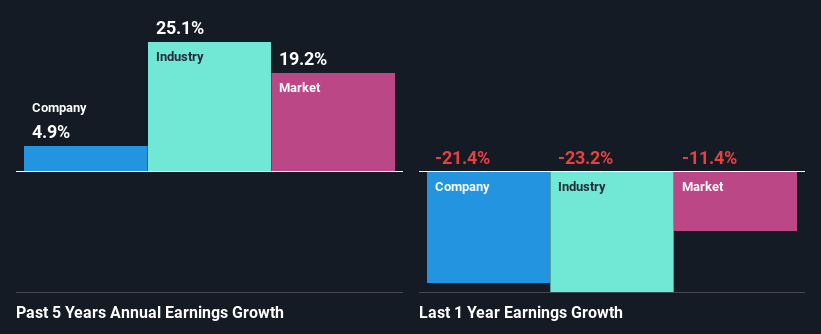
First thing first, we like that Rimoni Industries has an impressive ROE. Secondly, even when compared to the industry average of 15% the company's ROE is quite impressive. Despite this, Rimoni Industries' five year net income growth was quite low averaging at only 4.9%. This is interesting as the high returns should mean that the company has the ability to generate high growth but for some reason, it hasn't been able to do so. Such a scenario is likely to take place when a company pays out a huge portion of its earnings as dividends, or is faced with competitive pressures.
As a next step, we compared Rimoni Industries' net income growth with the industry and were disappointed to see that the company's growth is lower than the industry average growth of 25% in the same period.
The basis for attaching value to a company is, to a great extent, tied to its earnings growth. It’s important for an investor to know whether the market has priced in the company's expected earnings growth (or decline). Doing so will help them establish if the stock's future looks promising or ominous. If you're wondering about Rimoni Industries''s valuation, check out this gauge of its price-to-earnings ratio, as compared to its industry.
Is Rimoni Industries Using Its Retained Earnings Effectively?
Rimoni Industries has a very high three-year median payout ratio of 105%, which suggests that the company is dipping into more than just its profits to pay its dividend and that shows in its low earnings growth number. This is quite a risky position to be in.
Moreover, Rimoni Industries has been paying dividends for at least ten years or more suggesting that management must have perceived that the shareholders prefer dividends over earnings growth.
Conclusion
Overall, we have mixed feelings about Rimoni Industries. While the company does have a high rate of return, its low earnings retention is probably what's hampering its earnings growth. So far, we've only made a quick discussion around the company's earnings growth. To gain further insights into Rimoni Industries' past profit growth, check out this visualization of past earnings, revenue and cash flows.
New: AI Stock Screener & Alerts
Our new AI Stock Screener scans the market every day to uncover opportunities.
• Dividend Powerhouses (3%+ Yield)
• Undervalued Small Caps with Insider Buying
• High growth Tech and AI Companies
Or build your own from over 50 metrics.
Have feedback on this article? Concerned about the content? Get in touch with us directly. Alternatively, email editorial-team (at) simplywallst.com.
This article by Simply Wall St is general in nature. We provide commentary based on historical data and analyst forecasts only using an unbiased methodology and our articles are not intended to be financial advice. It does not constitute a recommendation to buy or sell any stock, and does not take account of your objectives, or your financial situation. We aim to bring you long-term focused analysis driven by fundamental data. Note that our analysis may not factor in the latest price-sensitive company announcements or qualitative material. Simply Wall St has no position in any stocks mentioned.
About TASE:RIMO
Rimoni Industries
Engages in the design, engineering, and manufacture of molds, and precise injection molding and assemblies for the medical, automotive, agricultural, high-tech, and consumer industries in Israel.
Flawless balance sheet with solid track record and pays a dividend.
Market Insights


Advertisement
Community Narratives
For the Emperor: Why Games Workshop Could Be a Star Investment
Fair Value UK£160.00|0.4% overvalued
RO
Community Contributor
Securitas will boost margins with AI and tech-driven services
Fair Value SEK 260.91|44.5% undervalued
UN
Community Contributor
A Leader in EV Charging with Growth Potential
Fair Value €27.00|17.8% undervalued
TI
Community Contributor