
Advertisement
- Israel
- /
- Oil and Gas
- /
- TASE:RATI
These 4 Measures Indicate That Ratio Oil Exploration (1992) Limited Partnership (TLV:RATI.L) Is Using Debt In A Risky Way
Howard Marks put it nicely when he said that, rather than worrying about share price volatility, 'The possibility of permanent loss is the risk I worry about... and every practical investor I know worries about.' So it seems the smart money knows that debt - which is usually involved in bankruptcies - is a very important factor, when you assess how risky a company is. We note that Ratio Oil Exploration (1992) Limited Partnership (TLV:RATI.L) does have debt on its balance sheet. But the real question is whether this debt is making the company risky.
When Is Debt Dangerous?
Debt assists a business until the business has trouble paying it off, either with new capital or with free cash flow. In the worst case scenario, a company can go bankrupt if it cannot pay its creditors. While that is not too common, we often do see indebted companies permanently diluting shareholders because lenders force them to raise capital at a distressed price. By replacing dilution, though, debt can be an extremely good tool for businesses that need capital to invest in growth at high rates of return. The first thing to do when considering how much debt a business uses is to look at its cash and debt together.
View our latest analysis for Ratio Oil Exploration (1992) Limited Partnership
What Is Ratio Oil Exploration (1992) Limited Partnership's Net Debt?
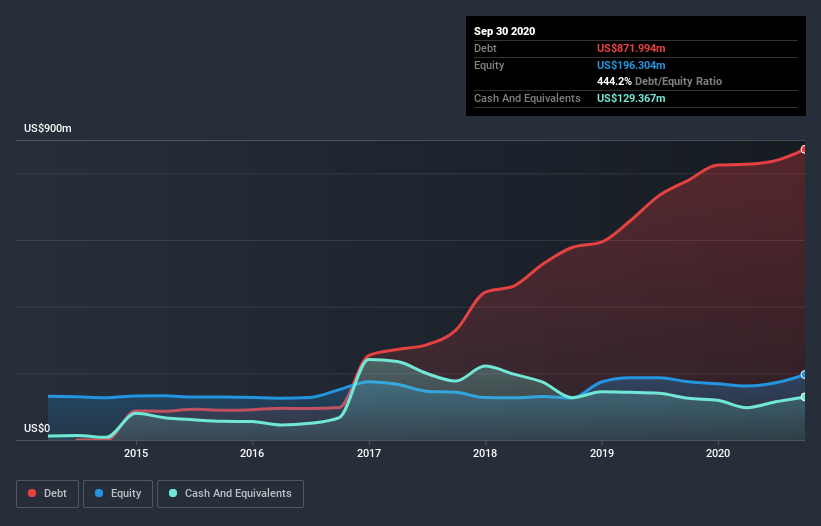
You can click the graphic below for the historical numbers, but it shows that as of September 2020 Ratio Oil Exploration (1992) Limited Partnership had US$872.0m of debt, an increase on US$779.4m, over one year. However, it also had US$129.4m in cash, and so its net debt is US$742.6m.
A Look At Ratio Oil Exploration (1992) Limited Partnership's Liabilities
We can see from the most recent balance sheet that Ratio Oil Exploration (1992) Limited Partnership had liabilities of US$161.0m falling due within a year, and liabilities of US$756.6m due beyond that. Offsetting these obligations, it had cash of US$129.4m as well as receivables valued at US$60.4m due within 12 months. So its liabilities outweigh the sum of its cash and (near-term) receivables by US$727.9m.
This deficit casts a shadow over the US$419.5m company, like a colossus towering over mere mortals. So we'd watch its balance sheet closely, without a doubt. After all, Ratio Oil Exploration (1992) Limited Partnership would likely require a major re-capitalisation if it had to pay its creditors today.
We use two main ratios to inform us about debt levels relative to earnings. The first is net debt divided by earnings before interest, tax, depreciation, and amortization (EBITDA), while the second is how many times its earnings before interest and tax (EBIT) covers its interest expense (or its interest cover, for short). The advantage of this approach is that we take into account both the absolute quantum of debt (with net debt to EBITDA) and the actual interest expenses associated with that debt (with its interest cover ratio).
Weak interest cover of 1.1 times and a disturbingly high net debt to EBITDA ratio of 7.6 hit our confidence in Ratio Oil Exploration (1992) Limited Partnership like a one-two punch to the gut. The debt burden here is substantial. However, the silver lining was that Ratio Oil Exploration (1992) Limited Partnership achieved a positive EBIT of US$80m in the last twelve months, an improvement on the prior year's loss. When analysing debt levels, the balance sheet is the obvious place to start. But you can't view debt in total isolation; since Ratio Oil Exploration (1992) Limited Partnership will need earnings to service that debt. So when considering debt, it's definitely worth looking at the earnings trend. Click here for an interactive snapshot.
Finally, a company can only pay off debt with cold hard cash, not accounting profits. So it's worth checking how much of the earnings before interest and tax (EBIT) is backed by free cash flow. During the last year, Ratio Oil Exploration (1992) Limited Partnership burned a lot of cash. While that may be a result of expenditure for growth, it does make the debt far more risky.
Our View
To be frank both Ratio Oil Exploration (1992) Limited Partnership's conversion of EBIT to free cash flow and its track record of staying on top of its total liabilities make us rather uncomfortable with its debt levels. But at least its EBIT growth rate is not so bad. We think the chances that Ratio Oil Exploration (1992) Limited Partnership has too much debt a very significant. To us, that makes the stock rather risky, like walking through a dog park with your eyes closed. But some investors may feel differently. There's no doubt that we learn most about debt from the balance sheet. However, not all investment risk resides within the balance sheet - far from it. For instance, we've identified 2 warning signs for Ratio Oil Exploration (1992) Limited Partnership (1 makes us a bit uncomfortable) you should be aware of.
When all is said and done, sometimes its easier to focus on companies that don't even need debt. Readers can access a list of growth stocks with zero net debt 100% free, right now.
If you’re looking to trade Ratio Oil Exploration (1992) Limited Partnership, open an account with the lowest-cost* platform trusted by professionals, Interactive Brokers. Their clients from over 200 countries and territories trade stocks, options, futures, forex, bonds and funds worldwide from a single integrated account. Promoted
New: AI Stock Screener & Alerts
Our new AI Stock Screener scans the market every day to uncover opportunities.
• Dividend Powerhouses (3%+ Yield)
• Undervalued Small Caps with Insider Buying
• High growth Tech and AI Companies
Or build your own from over 50 metrics.
This article by Simply Wall St is general in nature. It does not constitute a recommendation to buy or sell any stock, and does not take account of your objectives, or your financial situation. We aim to bring you long-term focused analysis driven by fundamental data. Note that our analysis may not factor in the latest price-sensitive company announcements or qualitative material. Simply Wall St has no position in any stocks mentioned.
*Interactive Brokers Rated Lowest Cost Broker by StockBrokers.com Annual Online Review 2020
Have feedback on this article? Concerned about the content? Get in touch with us directly. Alternatively, email editorial-team (at) simplywallst.com.
About TASE:RATI
Ratio Energies - Limited Partnership
Explores, develops, and produces oil and natural gas in Israel.
Good value with proven track record.
Market Insights

Advertisement
Community Narratives
Finding The True Value Of A Logistics Powerhouse
Fair Value US$95.21|8.4% undervalued
NV
Community Contributor
Paradigm Biopharmaceuticals Will Lead Osteoarthritis Treatment with Zilosul's FDA Success
Fair Value AU$5.50|92.1% undervalued
AM
Community Contributor
Barrick Mining (ABX:CA): A Gold Hedge against a U.S. Shutdown
Fair Value CA$60.00|24.2% undervalued
GM
Community Contributor