
Advertisement
- Israel
- /
- Food and Staples Retail
- /
- TASE:RMLI
Shareholders Of Rami Levi Chain Stores Hashikma Marketing 2006 (TLV:RMLI) Must Be Happy With Their 41% Return
If you buy and hold a stock for many years, you'd hope to be making a profit. Better yet, you'd like to see the share price move up more than the market average. But Rami Levi Chain Stores Hashikma Marketing 2006 Ltd (TLV:RMLI) has fallen short of that second goal, with a share price rise of 20% over five years, which is below the market return. Over the last twelve months the stock price has risen a very respectable 7.3%.
View our latest analysis for Rami Levi Chain Stores Hashikma Marketing 2006
There is no denying that markets are sometimes efficient, but prices do not always reflect underlying business performance. One flawed but reasonable way to assess how sentiment around a company has changed is to compare the earnings per share (EPS) with the share price.
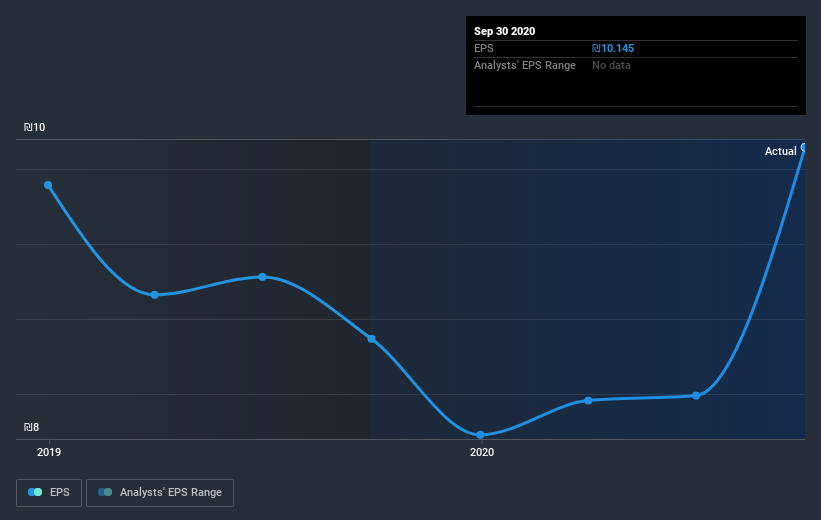
During five years of share price growth, Rami Levi Chain Stores Hashikma Marketing 2006 achieved compound earnings per share (EPS) growth of 12% per year. This EPS growth is higher than the 4% average annual increase in the share price. Therefore, it seems the market has become relatively pessimistic about the company.
The company's earnings per share (over time) is depicted in the image below (click to see the exact numbers).
This free interactive report on Rami Levi Chain Stores Hashikma Marketing 2006's earnings, revenue and cash flow is a great place to start, if you want to investigate the stock further.
What about the Total Shareholder Return (TSR)?
Investors should note that there's a difference between Rami Levi Chain Stores Hashikma Marketing 2006's total shareholder return (TSR) and its share price change, which we've covered above. Arguably the TSR is a more complete return calculation because it accounts for the value of dividends (as if they were reinvested), along with the hypothetical value of any discounted capital that have been offered to shareholders. Dividends have been really beneficial for Rami Levi Chain Stores Hashikma Marketing 2006 shareholders, and that cash payout contributed to why its TSR of 41%, over the last 5 years, is better than the share price return.
A Different Perspective
It's nice to see that Rami Levi Chain Stores Hashikma Marketing 2006 shareholders have received a total shareholder return of 12% over the last year. Since the one-year TSR is better than the five-year TSR (the latter coming in at 7% per year), it would seem that the stock's performance has improved in recent times. Someone with an optimistic perspective could view the recent improvement in TSR as indicating that the business itself is getting better with time. Is Rami Levi Chain Stores Hashikma Marketing 2006 cheap compared to other companies? These 3 valuation measures might help you decide.
If you like to buy stocks alongside management, then you might just love this free list of companies. (Hint: insiders have been buying them).
Please note, the market returns quoted in this article reflect the market weighted average returns of stocks that currently trade on IL exchanges.
When trading Rami Levi Chain Stores Hashikma Marketing 2006 or any other investment, use the platform considered by many to be the Professional's Gateway to the Worlds Market, Interactive Brokers. You get the lowest-cost* trading on stocks, options, futures, forex, bonds and funds worldwide from a single integrated account. Promoted
New: AI Stock Screener & Alerts
Our new AI Stock Screener scans the market every day to uncover opportunities.
• Dividend Powerhouses (3%+ Yield)
• Undervalued Small Caps with Insider Buying
• High growth Tech and AI Companies
Or build your own from over 50 metrics.
This article by Simply Wall St is general in nature. It does not constitute a recommendation to buy or sell any stock, and does not take account of your objectives, or your financial situation. We aim to bring you long-term focused analysis driven by fundamental data. Note that our analysis may not factor in the latest price-sensitive company announcements or qualitative material. Simply Wall St has no position in any stocks mentioned.
*Interactive Brokers Rated Lowest Cost Broker by StockBrokers.com Annual Online Review 2020
Have feedback on this article? Concerned about the content? Get in touch with us directly. Alternatively, email editorial-team (at) simplywallst.com.
About TASE:RMLI
Rami Levi Chain Stores Hashikma Marketing 2006
Operates a chain of discount format retail stores in Israel.
Average dividend payer with acceptable track record.
Similar Companies
Market Insights

Advertisement
Weekly Picks
TH


TheWallstreetKing on MicroVision ·
MicroVision will explode future revenue by 380.37% with a vision towards success
Fair Value:US$6098.4% undervalued
109 followersusers have followed this narrative
11 commentsusers have commented on this narrative
21 likesusers have liked this narrative
TI


TibiT on Canadian National Railway ·
The Indispensable Artery for a New North American Economy
Fair Value:CA$132.870.7% overvalued
20 followersusers have followed this narrative
4 commentsusers have commented on this narrative
3 likesusers have liked this narrative
RE

RecMag on Agfa-Gevaert ·
Agfa-Gevaert is a digital and materials turnaround opportunity, with growth potential in ZIRFON, but carrying legacy risks.
Fair Value:€5.3988.2% undervalued
19 followersusers have followed this narrative
0 commentsusers have commented on this narrative
3 likesusers have liked this narrative
Recently Updated Narratives
NI

niteco on Texas Instruments ·
Engineered for Stability. Positioned for Growth.
Fair Value:US$314.4446.5% undervalued
2 followersusers have followed this narrative
0 commentsusers have commented on this narrative
0 likesusers have liked this narrative
BE


Bejgal on MINISO Group Holding ·
MINISO's fair value is projected at 26.69 with an anticipated PE ratio shift of 20x
Fair Value:US$28.1829.8% undervalued
46 followersusers have followed this narrative
3 commentsusers have commented on this narrative
0 likesusers have liked this narrative
BE

Bejgal on Fiverr International ·
Fiverr International will transform the freelance industry with AI-powered growth
Fair Value:US$36.8143.6% undervalued
79 followersusers have followed this narrative
7 commentsusers have commented on this narrative
1 likeusers have liked this narrative
Popular Narratives
TH
TheWallstreetKing on MicroVision ·
MicroVision will explode future revenue by 380.37% with a vision towards success
Fair Value:US$6098.4% undervalued
109 followersusers have followed this narrative
11 commentsusers have commented on this narrative
21 likesusers have liked this narrative
AN


AnalystConsensusTarget on NVIDIA ·
NVDA: Expanding AI Demand Will Drive Major Data Center Investments Through 2026
Fair Value:US$250.3928.1% undervalued
939 followersusers have followed this narrative
6 commentsusers have commented on this narrative
24 likesusers have liked this narrative
OS


oscargarcia on Alphabet ·
The company that turned a verb into a global necessity and basically runs the modern internet, digital ads, smartphones, maps, and AI.
Fair Value:US$3407.4% undervalued
145 followersusers have followed this narrative
6 commentsusers have commented on this narrative
18 likesusers have liked this narrative