
Advertisement
- Israel
- /
- Food and Staples Retail
- /
- TASE:HMAM
Hamama Meir Trading (1996) (TLV:HMAM) Is Experiencing Growth In Returns On Capital
To find a multi-bagger stock, what are the underlying trends we should look for in a business? Typically, we'll want to notice a trend of growing return on capital employed (ROCE) and alongside that, an expanding base of capital employed. If you see this, it typically means it's a company with a great business model and plenty of profitable reinvestment opportunities. With that in mind, we've noticed some promising trends at Hamama Meir Trading (1996) (TLV:HMAM) so let's look a bit deeper.
Return On Capital Employed (ROCE): What Is It?
If you haven't worked with ROCE before, it measures the 'return' (pre-tax profit) a company generates from capital employed in its business. The formula for this calculation on Hamama Meir Trading (1996) is:
Return on Capital Employed = Earnings Before Interest and Tax (EBIT) ÷ (Total Assets - Current Liabilities)
0.081 = ₪8.1m ÷ (₪172m - ₪71m) (Based on the trailing twelve months to December 2024).
Thus, Hamama Meir Trading (1996) has an ROCE of 8.1%. In absolute terms, that's a low return and it also under-performs the Consumer Retailing industry average of 11%.
See our latest analysis for Hamama Meir Trading (1996)
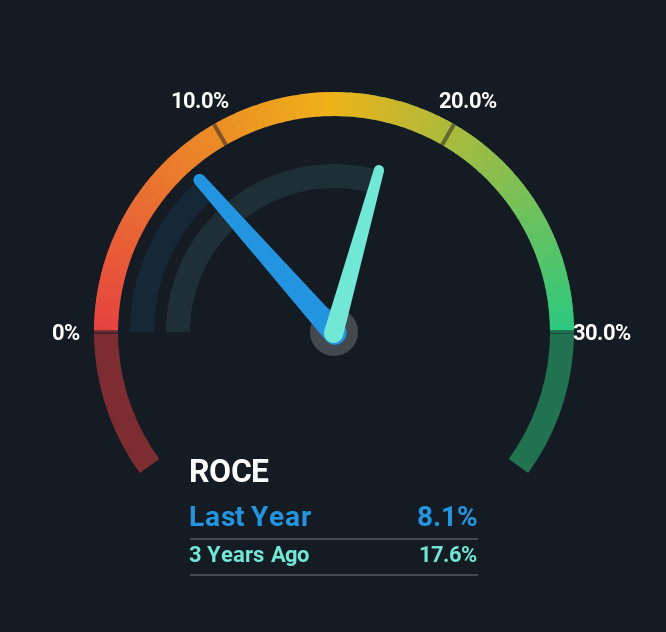
Historical performance is a great place to start when researching a stock so above you can see the gauge for Hamama Meir Trading (1996)'s ROCE against it's prior returns. If you want to delve into the historical earnings , check out these free graphs detailing revenue and cash flow performance of Hamama Meir Trading (1996).
What Can We Tell From Hamama Meir Trading (1996)'s ROCE Trend?
Hamama Meir Trading (1996) has recently broken into profitability so their prior investments seem to be paying off. The company was generating losses five years ago, but now it's earning 8.1% which is a sight for sore eyes. In addition to that, Hamama Meir Trading (1996) is employing 24% more capital than previously which is expected of a company that's trying to break into profitability. We like this trend, because it tells us the company has profitable reinvestment opportunities available to it, and if it continues going forward that can lead to a multi-bagger performance.
One more thing to note, Hamama Meir Trading (1996) has decreased current liabilities to 42% of total assets over this period, which effectively reduces the amount of funding from suppliers or short-term creditors. So this improvement in ROCE has come from the business' underlying economics, which is great to see. Nevertheless, there are some potential risks the company is bearing with current liabilities that high, so just keep that in mind.
In Conclusion...
In summary, it's great to see that Hamama Meir Trading (1996) has managed to break into profitability and is continuing to reinvest in its business. Since the stock has returned a solid 77% to shareholders over the last five years, it's fair to say investors are beginning to recognize these changes. With that being said, we still think the promising fundamentals mean the company deserves some further due diligence.
Hamama Meir Trading (1996) does have some risks though, and we've spotted 1 warning sign for Hamama Meir Trading (1996) that you might be interested in.
If you want to search for solid companies with great earnings, check out this free list of companies with good balance sheets and impressive returns on equity.
Valuation is complex, but we're here to simplify it.
Discover if Hamama Meir Trading (1996) might be undervalued or overvalued with our detailed analysis, featuring fair value estimates, potential risks, dividends, insider trades, and its financial condition.
Access Free AnalysisHave feedback on this article? Concerned about the content? Get in touch with us directly. Alternatively, email editorial-team (at) simplywallst.com.
This article by Simply Wall St is general in nature. We provide commentary based on historical data and analyst forecasts only using an unbiased methodology and our articles are not intended to be financial advice. It does not constitute a recommendation to buy or sell any stock, and does not take account of your objectives, or your financial situation. We aim to bring you long-term focused analysis driven by fundamental data. Note that our analysis may not factor in the latest price-sensitive company announcements or qualitative material. Simply Wall St has no position in any stocks mentioned.
About TASE:HMAM
Hamama Meir Trading (1996)
Engages in the import and distribution of raw materials for the food industry in Israel.
Flawless balance sheet with solid track record.
Market Insights

Advertisement
Weekly Picks
RO


RockeTeller on Santacruz Silver Mining ·
Crazy Undervalued 42 Baggers Silver Play (Active & Running Mine)
Fair Value:CA$8696.7% undervalued
29 followersusers have followed this narrative
6 commentsusers have commented on this narrative
7 likesusers have liked this narrative
RO


Robbo on Fiducian Group ·
Fiducian: Compliance Clouds or Value Opportunity?
Fair Value:AU$126.1% undervalued
4 followersusers have followed this narrative
0 commentsusers have commented on this narrative
0 likesusers have liked this narrative
WO

woodworthfund on Willamette Valley Vineyards ·
Willamette Valley Vineyards (WVVI): Not-So-Great Value
Fair Value:US$242.5% overvalued
5 followersusers have followed this narrative
0 commentsusers have commented on this narrative
1 likeusers have liked this narrative
Recently Updated Narratives
MA


MarkoVT on Alphabet ·
Positioned globally, partnered locally
Fair Value:US$390.1919.1% undervalued
1 followerusers have followed this narrative
0 commentsusers have commented on this narrative
0 likesusers have liked this narrative
JO


JohnJ on Worldline ·
When will fraudsters be investigated in depth. Fraud was ongoing in France too.
Fair Value:€0.5190.0% overvalued
1 followerusers have followed this narrative
0 commentsusers have commented on this narrative
0 likesusers have liked this narrative
MA

MarkoVT on Applied Digital ·
Staggered by dilution; positions for growth
Fair Value:US$35.4520.9% undervalued
5 followersusers have followed this narrative
0 commentsusers have commented on this narrative
0 likesusers have liked this narrative
Popular Narratives
TH


TheWallstreetKing on MicroVision ·
MicroVision will explode future revenue by 380.37% with a vision towards success
Fair Value:US$6098.6% undervalued
112 followersusers have followed this narrative
11 commentsusers have commented on this narrative
22 likesusers have liked this narrative
AN


AnalystConsensusTarget on NVIDIA ·
NVDA: Expanding AI Demand Will Drive Major Data Center Investments Through 2026
Fair Value:US$250.3927.5% undervalued
949 followersusers have followed this narrative
6 commentsusers have commented on this narrative
25 likesusers have liked this narrative
OS

oscargarcia on Alphabet ·
The company that turned a verb into a global necessity and basically runs the modern internet, digital ads, smartphones, maps, and AI.
Fair Value:US$3407.1% undervalued
148 followersusers have followed this narrative
6 commentsusers have commented on this narrative
18 likesusers have liked this narrative

