
Advertisement
- Israel
- /
- Commercial Services
- /
- TASE:ARAN
Aran Research & Development (1982)'s (TLV:ARAN) Solid Profits Have Weak Fundamentals
Aran Research & Development (1982) Ltd.'s (TLV:ARAN) robust earnings report didn't manage to move the market for its stock. Our analysis suggests that this might be because shareholders have noticed some concerning underlying factors.
See our latest analysis for Aran Research & Development (1982)
Examining Cashflow Against Aran Research & Development (1982)'s Earnings
One key financial ratio used to measure how well a company converts its profit to free cash flow (FCF) is the accrual ratio. The accrual ratio subtracts the FCF from the profit for a given period, and divides the result by the average operating assets of the company over that time. You could think of the accrual ratio from cashflow as the 'non-FCF profit ratio'.
That means a negative accrual ratio is a good thing, because it shows that the company is bringing in more free cash flow than its profit would suggest. While having an accrual ratio above zero is of little concern, we do think it's worth noting when a company has a relatively high accrual ratio. Notably, there is some academic evidence that suggests that a high accrual ratio is a bad sign for near-term profits, generally speaking.
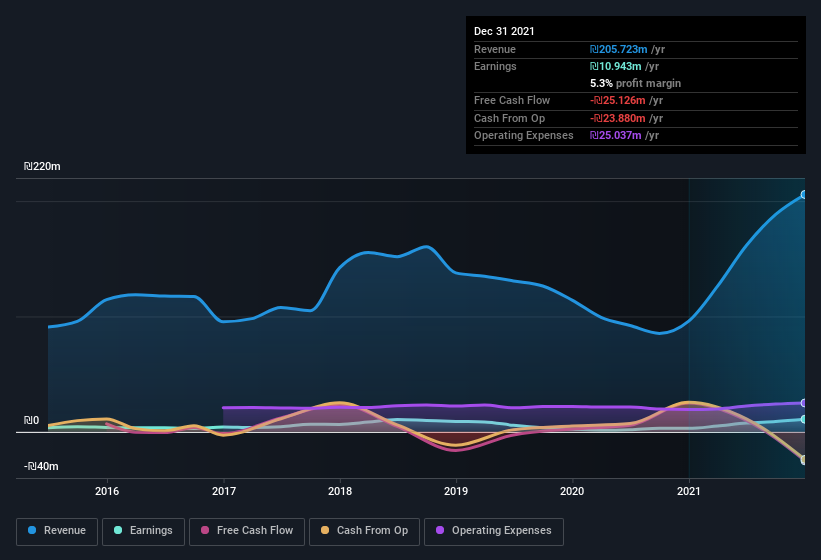
For the year to December 2021, Aran Research & Development (1982) had an accrual ratio of 0.68. As a general rule, that bodes poorly for future profitability. To wit, the company did not generate one whit of free cashflow in that time. In the last twelve months it actually had negative free cash flow, with an outflow of ₪25m despite its profit of ₪10.9m, mentioned above. We saw that FCF was ₪25m a year ago though, so Aran Research & Development (1982) has at least been able to generate positive FCF in the past. One positive for Aran Research & Development (1982) shareholders is that it's accrual ratio was significantly better last year, providing reason to believe that it may return to stronger cash conversion in the future. As a result, some shareholders may be looking for stronger cash conversion in the current year.
Note: we always recommend investors check balance sheet strength. Click here to be taken to our balance sheet analysis of Aran Research & Development (1982).
Our Take On Aran Research & Development (1982)'s Profit Performance
As we have made quite clear, we're a bit worried that Aran Research & Development (1982) didn't back up the last year's profit with free cashflow. As a result, we think it may well be the case that Aran Research & Development (1982)'s underlying earnings power is lower than its statutory profit. But the happy news is that, while acknowledging we have to look beyond the statutory numbers, those numbers are still improving, with EPS growing at a very high rate over the last year. Of course, we've only just scratched the surface when it comes to analysing its earnings; one could also consider margins, forecast growth, and return on investment, among other factors. So if you'd like to dive deeper into this stock, it's crucial to consider any risks it's facing. Every company has risks, and we've spotted 3 warning signs for Aran Research & Development (1982) (of which 1 is potentially serious!) you should know about.
Today we've zoomed in on a single data point to better understand the nature of Aran Research & Development (1982)'s profit. But there are plenty of other ways to inform your opinion of a company. Some people consider a high return on equity to be a good sign of a quality business. While it might take a little research on your behalf, you may find this free collection of companies boasting high return on equity, or this list of stocks that insiders are buying to be useful.
New: Manage All Your Stock Portfolios in One Place
We've created the ultimate portfolio companion for stock investors, and it's free.
• Connect an unlimited number of Portfolios and see your total in one currency
• Be alerted to new Warning Signs or Risks via email or mobile
• Track the Fair Value of your stocks
Have feedback on this article? Concerned about the content? Get in touch with us directly. Alternatively, email editorial-team (at) simplywallst.com.
This article by Simply Wall St is general in nature. We provide commentary based on historical data and analyst forecasts only using an unbiased methodology and our articles are not intended to be financial advice. It does not constitute a recommendation to buy or sell any stock, and does not take account of your objectives, or your financial situation. We aim to bring you long-term focused analysis driven by fundamental data. Note that our analysis may not factor in the latest price-sensitive company announcements or qualitative material. Simply Wall St has no position in any stocks mentioned.
About TASE:ARAN
Aran Research & Development (1982)
Engages in the product design and development, and equipment manufacturing businesses for plastics industry in Israel.
Flawless balance sheet with solid track record and pays a dividend.
Market Insights

Advertisement
Community Narratives
The Next Phase of Energy Storage: How NeoVolta Is Tackling America’s Power Crunch
Fair Value US$7.50|35.1% undervalued
MA
Community Contributor
Why EnSilica is Worth Possibly 13x its Current Price
Fair Value UK£5.00|89.8% undervalued
DO
Community Contributor
M&A Activity, Industry Diversification & A Defense Contract Monopoly Will Push BWXT For Healthy Long-Term Growth
Fair Value US$220.00|15.2% undervalued
CL
Community Contributor
A case for Cassiar Gold Corp (TSXV: GLDC) to reach CAD$8-10 before 2030 (X30-37)
Fair Value CA$10.00|96.0% undervalued
AG
Community Contributor