

If you're looking for a multi-bagger, there's a few things to keep an eye out for. In a perfect world, we'd like to see a company investing more capital into its business and ideally the returns earned from that capital are also increasing. Ultimately, this demonstrates that it's a business that is reinvesting profits at increasing rates of return. With that in mind, the ROCE of Guangdong Investment (HKG:270) looks decent, right now, so lets see what the trend of returns can tell us.
Understanding Return On Capital Employed (ROCE)
If you haven't worked with ROCE before, it measures the 'return' (pre-tax profit) a company generates from capital employed in its business. Analysts use this formula to calculate it for Guangdong Investment:
Return on Capital Employed = Earnings Before Interest and Tax (EBIT) ÷ (Total Assets - Current Liabilities)
0.11 = HK$7.7b ÷ (HK$90b - HK$20b) (Based on the trailing twelve months to March 2021).
So, Guangdong Investment has an ROCE of 11%. On its own, that's a standard return, however it's much better than the 7.3% generated by the Water Utilities industry.
Check out our latest analysis for Guangdong Investment
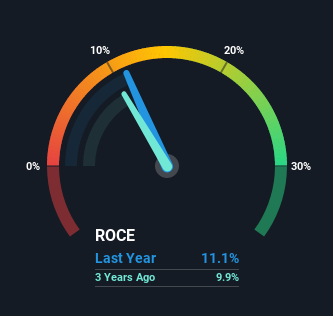
In the above chart we have measured Guangdong Investment's prior ROCE against its prior performance, but the future is arguably more important. If you're interested, you can view the analysts predictions in our free report on analyst forecasts for the company.
How Are Returns Trending?
While the returns on capital are good, they haven't moved much. Over the past five years, ROCE has remained relatively flat at around 11% and the business has deployed 44% more capital into its operations. Since 11% is a moderate ROCE though, it's good to see a business can continue to reinvest at these decent rates of return. Stable returns in this ballpark can be unexciting, but if they can be maintained over the long run, they often provide nice rewards to shareholders.
On another note, while the change in ROCE trend might not scream for attention, it's interesting that the current liabilities have actually gone up over the last five years. This is intriguing because if current liabilities hadn't increased to 22% of total assets, this reported ROCE would probably be less than11% because total capital employed would be higher.The 11% ROCE could be even lower if current liabilities weren't 22% of total assets, because the the formula would show a larger base of total capital employed. With that in mind, just be wary if this ratio increases in the future, because if it gets particularly high, this brings with it some new elements of risk.
The Key Takeaway
The main thing to remember is that Guangdong Investment has proven its ability to continually reinvest at respectable rates of return. And given the stock has only risen 13% over the last five years, we'd suspect the market is beginning to recognize these trends. So because of the trends we're seeing, we'd recommend looking further into this stock to see if it has the makings of a multi-bagger.
One more thing to note, we've identified 1 warning sign with Guangdong Investment and understanding this should be part of your investment process.
If you want to search for solid companies with great earnings, check out this free list of companies with good balance sheets and impressive returns on equity.
When trading stocks or any other investment, use the platform considered by many to be the Professional's Gateway to the Worlds Market, Interactive Brokers. You get the lowest-cost* trading on stocks, options, futures, forex, bonds and funds worldwide from a single integrated account. Promoted
If you're looking to trade Guangdong Investment, open an account with the lowest-cost platform trusted by professionals, Interactive Brokers.
With clients in over 200 countries and territories, and access to 160 markets, IBKR lets you trade stocks, options, futures, forex, bonds and funds from a single integrated account.
Enjoy no hidden fees, no account minimums, and FX conversion rates as low as 0.03%, far better than what most brokers offer.
Sponsored ContentNew: Manage All Your Stock Portfolios in One Place
We've created the ultimate portfolio companion for stock investors, and it's free.
• Connect an unlimited number of Portfolios and see your total in one currency
• Be alerted to new Warning Signs or Risks via email or mobile
• Track the Fair Value of your stocks
This article by Simply Wall St is general in nature. We provide commentary based on historical data and analyst forecasts only using an unbiased methodology and our articles are not intended to be financial advice. It does not constitute a recommendation to buy or sell any stock, and does not take account of your objectives, or your financial situation. We aim to bring you long-term focused analysis driven by fundamental data. Note that our analysis may not factor in the latest price-sensitive company announcements or qualitative material. Simply Wall St has no position in any stocks mentioned.
*Interactive Brokers Rated Lowest Cost Broker by StockBrokers.com Annual Online Review 2020
Have feedback on this article? Concerned about the content? Get in touch with us directly. Alternatively, email editorial-team (at) simplywallst.com.
About SEHK:270
Guangdong Investment
An investment holding company, engages in water resources, property investment and development, department store operation, hotel ownership, energy project operation and management, and road and bridge operation businesses.
Adequate balance sheet average dividend payer.

