
Advertisement
- Hong Kong
- /
- Renewable Energy
- /
- SEHK:1071
Huadian Power International Corporation Limited's (HKG:1071) 26% Price Boost Is Out Of Tune With Revenues
The Huadian Power International Corporation Limited (HKG:1071) share price has done very well over the last month, posting an excellent gain of 26%. Looking further back, the 25% rise over the last twelve months isn't too bad notwithstanding the strength over the last 30 days.
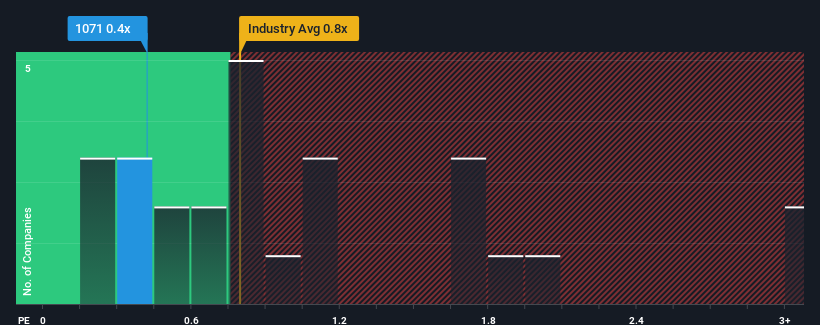
Even after such a large jump in price, there still wouldn't be many who think Huadian Power International's price-to-sales (or "P/S") ratio of 0.4x is worth a mention when the median P/S in Hong Kong's Renewable Energy industry is similar at about 0.8x. Although, it's not wise to simply ignore the P/S without explanation as investors may be disregarding a distinct opportunity or a costly mistake.
Check out our latest analysis for Huadian Power International
What Does Huadian Power International's Recent Performance Look Like?
With revenue growth that's superior to most other companies of late, Huadian Power International has been doing relatively well. Perhaps the market is expecting this level of performance to taper off, keeping the P/S from soaring. If you like the company, you'd be hoping this isn't the case so that you could potentially pick up some stock while it's not quite in favour.
If you'd like to see what analysts are forecasting going forward, you should check out our free report on Huadian Power International.What Are Revenue Growth Metrics Telling Us About The P/S?
The only time you'd be comfortable seeing a P/S like Huadian Power International's is when the company's growth is tracking the industry closely.
Taking a look back first, we see that the company managed to grow revenues by a handy 5.4% last year. Revenue has also lifted 15% in aggregate from three years ago, partly thanks to the last 12 months of growth. So we can start by confirming that the company has actually done a good job of growing revenue over that time.
Turning to the outlook, the next three years should generate growth of 1.8% each year as estimated by the seven analysts watching the company. That's shaping up to be materially lower than the 5.6% per annum growth forecast for the broader industry.
With this information, we find it interesting that Huadian Power International is trading at a fairly similar P/S compared to the industry. It seems most investors are ignoring the fairly limited growth expectations and are willing to pay up for exposure to the stock. Maintaining these prices will be difficult to achieve as this level of revenue growth is likely to weigh down the shares eventually.
The Final Word
Its shares have lifted substantially and now Huadian Power International's P/S is back within range of the industry median. We'd say the price-to-sales ratio's power isn't primarily as a valuation instrument but rather to gauge current investor sentiment and future expectations.
When you consider that Huadian Power International's revenue growth estimates are fairly muted compared to the broader industry, it's easy to see why we consider it unexpected to be trading at its current P/S ratio. At present, we aren't confident in the P/S as the predicted future revenues aren't likely to support a more positive sentiment for long. Circumstances like this present a risk to current and prospective investors who may see share prices fall if the low revenue growth impacts the sentiment.
And what about other risks? Every company has them, and we've spotted 1 warning sign for Huadian Power International you should know about.
Of course, profitable companies with a history of great earnings growth are generally safer bets. So you may wish to see this free collection of other companies that have reasonable P/E ratios and have grown earnings strongly.
Valuation is complex, but we're here to simplify it.
Discover if Huadian Power International might be undervalued or overvalued with our detailed analysis, featuring fair value estimates, potential risks, dividends, insider trades, and its financial condition.
Access Free AnalysisHave feedback on this article? Concerned about the content? Get in touch with us directly. Alternatively, email editorial-team (at) simplywallst.com.
This article by Simply Wall St is general in nature. We provide commentary based on historical data and analyst forecasts only using an unbiased methodology and our articles are not intended to be financial advice. It does not constitute a recommendation to buy or sell any stock, and does not take account of your objectives, or your financial situation. We aim to bring you long-term focused analysis driven by fundamental data. Note that our analysis may not factor in the latest price-sensitive company announcements or qualitative material. Simply Wall St has no position in any stocks mentioned.
About SEHK:1071
Huadian Power International
Engages in the generation and sale of electricity, heat, and coal to power grid companies in the People’s Republic of China.
Undervalued with proven track record.
Market Insights


Advertisement
Community Narratives
Nike's Direct-to-Consumer Focus Will Drive Future Growth
Fair Value US$87.90|22.7% undervalued
UN
Community Contributor
Novo Nordisk will dominate GLP-1 market with Ozempic and Wegovy growth
Fair Value US$89.59|14.2% undervalued
BE
Community Contributor
Rheinmetall could get 20-25% of EU-NATO 3%-GDP defence spending
Fair Value €7.57k|82.8% undervalued
NO
Community Contributor