Not Many Are Piling Into Frontier Services Group Limited (HKG:500) Stock Yet As It Plummets 27%


Frontier Services Group Limited (HKG:500) shareholders won't be pleased to see that the share price has had a very rough month, dropping 27% and undoing the prior period's positive performance. The drop over the last 30 days has capped off a tough year for shareholders, with the share price down 31% in that time.
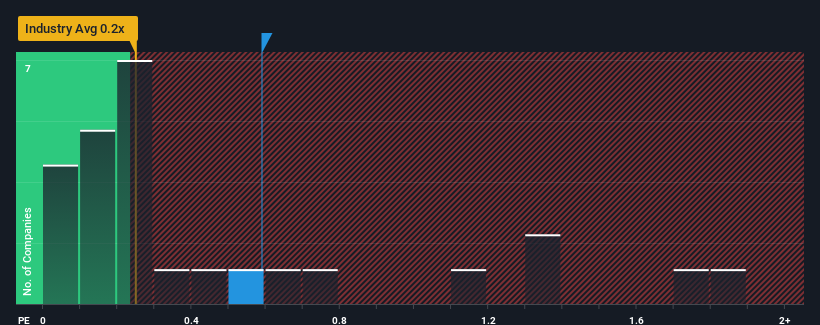
Although its price has dipped substantially, you could still be forgiven for feeling indifferent about Frontier Services Group's P/S ratio of 0.6x, since the median price-to-sales (or "P/S") ratio for the Logistics industry in Hong Kong is also close to 0.2x. However, investors might be overlooking a clear opportunity or potential setback if there is no rational basis for the P/S.
View our latest analysis for Frontier Services Group
What Does Frontier Services Group's Recent Performance Look Like?
For instance, Frontier Services Group's receding revenue in recent times would have to be some food for thought. One possibility is that the P/S is moderate because investors think the company might still do enough to be in line with the broader industry in the near future. If not, then existing shareholders may be a little nervous about the viability of the share price.
We don't have analyst forecasts, but you can see how recent trends are setting up the company for the future by checking out our free report on Frontier Services Group's earnings, revenue and cash flow.Is There Some Revenue Growth Forecasted For Frontier Services Group?
There's an inherent assumption that a company should be matching the industry for P/S ratios like Frontier Services Group's to be considered reasonable.
Taking a look back first, the company's revenue growth last year wasn't something to get excited about as it posted a disappointing decline of 6.3%. Even so, admirably revenue has lifted 38% in aggregate from three years ago, notwithstanding the last 12 months. Accordingly, while they would have preferred to keep the run going, shareholders would definitely welcome the medium-term rates of revenue growth.
This is in contrast to the rest of the industry, which is expected to grow by 4.9% over the next year, materially lower than the company's recent medium-term annualised growth rates.
In light of this, it's curious that Frontier Services Group's P/S sits in line with the majority of other companies. It may be that most investors are not convinced the company can maintain its recent growth rates.
What We Can Learn From Frontier Services Group's P/S?
Following Frontier Services Group's share price tumble, its P/S is just clinging on to the industry median P/S. Typically, we'd caution against reading too much into price-to-sales ratios when settling on investment decisions, though it can reveal plenty about what other market participants think about the company.
We've established that Frontier Services Group currently trades on a lower than expected P/S since its recent three-year growth is higher than the wider industry forecast. It'd be fair to assume that potential risks the company faces could be the contributing factor to the lower than expected P/S. It appears some are indeed anticipating revenue instability, because the persistence of these recent medium-term conditions would normally provide a boost to the share price.
You always need to take note of risks, for example - Frontier Services Group has 4 warning signs we think you should be aware of.
If companies with solid past earnings growth is up your alley, you may wish to see this free collection of other companies with strong earnings growth and low P/E ratios.
New: AI Stock Screener & Alerts
Our new AI Stock Screener scans the market every day to uncover opportunities.
• Dividend Powerhouses (3%+ Yield)
• Undervalued Small Caps with Insider Buying
• High growth Tech and AI Companies
Or build your own from over 50 metrics.
Have feedback on this article? Concerned about the content? Get in touch with us directly. Alternatively, email editorial-team (at) simplywallst.com.
This article by Simply Wall St is general in nature. We provide commentary based on historical data and analyst forecasts only using an unbiased methodology and our articles are not intended to be financial advice. It does not constitute a recommendation to buy or sell any stock, and does not take account of your objectives, or your financial situation. We aim to bring you long-term focused analysis driven by fundamental data. Note that our analysis may not factor in the latest price-sensitive company announcements or qualitative material. Simply Wall St has no position in any stocks mentioned.
About SEHK:500
Frontier Services Group
An investment holding company, provides aviation, logistics, security, insurance, and infrastructure related services.
Fair value with mediocre balance sheet.
Similar Companies
Market Insights

Community Narratives

