

David Iben put it well when he said, 'Volatility is not a risk we care about. What we care about is avoiding the permanent loss of capital.' When we think about how risky a company is, we always like to look at its use of debt, since debt overload can lead to ruin. We can see that Frontier Services Group Limited (HKG:500) does use debt in its business. But is this debt a concern to shareholders?
Why Does Debt Bring Risk?
Generally speaking, debt only becomes a real problem when a company can't easily pay it off, either by raising capital or with its own cash flow. In the worst case scenario, a company can go bankrupt if it cannot pay its creditors. However, a more usual (but still expensive) situation is where a company must dilute shareholders at a cheap share price simply to get debt under control. Of course, debt can be an important tool in businesses, particularly capital heavy businesses. When we examine debt levels, we first consider both cash and debt levels, together.
See our latest analysis for Frontier Services Group
What Is Frontier Services Group's Net Debt?
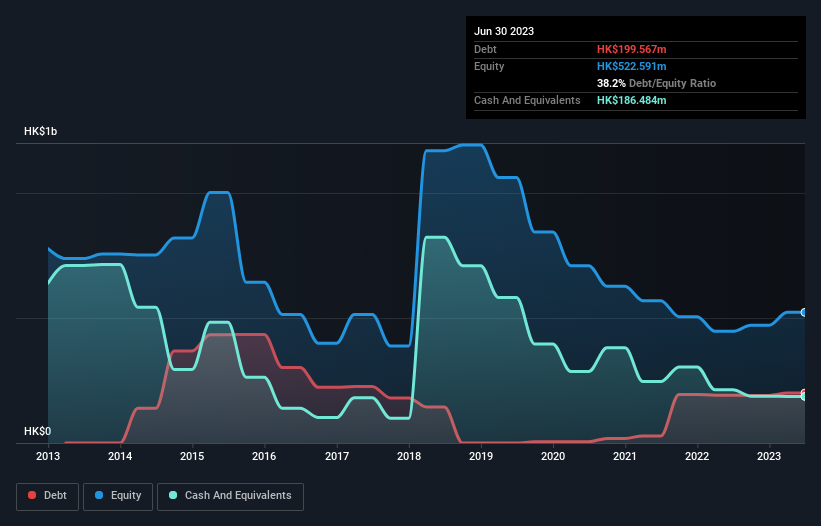
As you can see below, at the end of June 2023, Frontier Services Group had HK$199.6m of debt, up from HK$191.4m a year ago. Click the image for more detail. However, it also had HK$186.5m in cash, and so its net debt is HK$13.1m.
A Look At Frontier Services Group's Liabilities
Zooming in on the latest balance sheet data, we can see that Frontier Services Group had liabilities of HK$322.9m due within 12 months and liabilities of HK$258.2m due beyond that. Offsetting this, it had HK$186.5m in cash and HK$334.3m in receivables that were due within 12 months. So it has liabilities totalling HK$60.3m more than its cash and near-term receivables, combined.
Of course, Frontier Services Group has a market capitalization of HK$519.1m, so these liabilities are probably manageable. But there are sufficient liabilities that we would certainly recommend shareholders continue to monitor the balance sheet, going forward. There's no doubt that we learn most about debt from the balance sheet. But it is Frontier Services Group's earnings that will influence how the balance sheet holds up in the future. So if you're keen to discover more about its earnings, it might be worth checking out this graph of its long term earnings trend.
Over 12 months, Frontier Services Group made a loss at the EBIT level, and saw its revenue drop to HK$890m, which is a fall of 6.3%. That's not what we would hope to see.
Caveat Emptor
Over the last twelve months Frontier Services Group produced an earnings before interest and tax (EBIT) loss. Indeed, it lost HK$34m at the EBIT level. Considering that alongside the liabilities mentioned above does not give us much confidence that company should be using so much debt. So we think its balance sheet is a little strained, though not beyond repair. However, it doesn't help that it burned through HK$4.1m of cash over the last year. So to be blunt we think it is risky. When analysing debt levels, the balance sheet is the obvious place to start. However, not all investment risk resides within the balance sheet - far from it. We've identified 4 warning signs with Frontier Services Group , and understanding them should be part of your investment process.
Of course, if you're the type of investor who prefers buying stocks without the burden of debt, then don't hesitate to discover our exclusive list of net cash growth stocks, today.
If you're looking to trade Frontier Services Group, open an account with the lowest-cost platform trusted by professionals, Interactive Brokers.
With clients in over 200 countries and territories, and access to 160 markets, IBKR lets you trade stocks, options, futures, forex, bonds and funds from a single integrated account.
Enjoy no hidden fees, no account minimums, and FX conversion rates as low as 0.03%, far better than what most brokers offer.
Sponsored ContentNew: AI Stock Screener & Alerts
Our new AI Stock Screener scans the market every day to uncover opportunities.
• Dividend Powerhouses (3%+ Yield)
• Undervalued Small Caps with Insider Buying
• High growth Tech and AI Companies
Or build your own from over 50 metrics.
Have feedback on this article? Concerned about the content? Get in touch with us directly. Alternatively, email editorial-team (at) simplywallst.com.
This article by Simply Wall St is general in nature. We provide commentary based on historical data and analyst forecasts only using an unbiased methodology and our articles are not intended to be financial advice. It does not constitute a recommendation to buy or sell any stock, and does not take account of your objectives, or your financial situation. We aim to bring you long-term focused analysis driven by fundamental data. Note that our analysis may not factor in the latest price-sensitive company announcements or qualitative material. Simply Wall St has no position in any stocks mentioned.
About SEHK:500
Frontier Services Group
An investment holding company, provides aviation, logistics, security, insurance, and infrastructure related services.
Fair value with mediocre balance sheet.
Similar Companies
Market Insights

Community Narratives

