
Advertisement
- Hong Kong
- /
- Marine and Shipping
- /
- SEHK:3683
Great Harvest Maeta Holdings Limited (HKG:3683) Stocks Pounded By 27% But Not Lagging Industry On Growth Or Pricing

The Great Harvest Maeta Holdings Limited (HKG:3683) share price has softened a substantial 27% over the previous 30 days, handing back much of the gains the stock has made lately. Longer-term shareholders will rue the drop in the share price, since it's now virtually flat for the year after a promising few quarters.
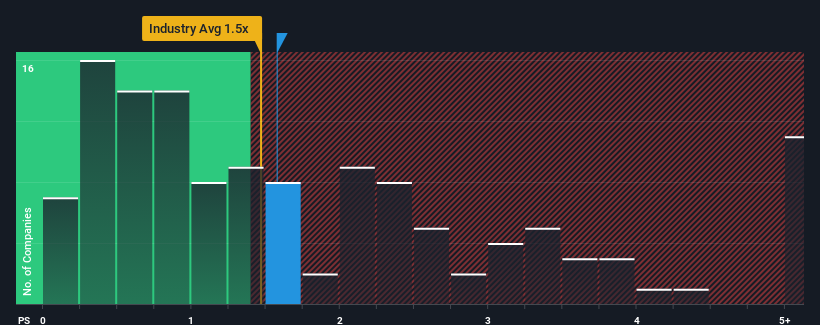
Even after such a large drop in price, given close to half the companies operating in Hong Kong's Shipping industry have price-to-sales ratios (or "P/S") below 0.9x, you may still consider Great Harvest Maeta Holdings as a stock to potentially avoid with its 1.6x P/S ratio. However, the P/S might be high for a reason and it requires further investigation to determine if it's justified.
View our latest analysis for Great Harvest Maeta Holdings
How Has Great Harvest Maeta Holdings Performed Recently?
For example, consider that Great Harvest Maeta Holdings' financial performance has been poor lately as its revenue has been in decline. It might be that many expect the company to still outplay most other companies over the coming period, which has kept the P/S from collapsing. If not, then existing shareholders may be quite nervous about the viability of the share price.
Want the full picture on earnings, revenue and cash flow for the company? Then our free report on Great Harvest Maeta Holdings will help you shine a light on its historical performance.Do Revenue Forecasts Match The High P/S Ratio?
The only time you'd be truly comfortable seeing a P/S as high as Great Harvest Maeta Holdings' is when the company's growth is on track to outshine the industry.
In reviewing the last year of financials, we were disheartened to see the company's revenues fell to the tune of 36%. Still, the latest three year period has seen an excellent 31% overall rise in revenue, in spite of its unsatisfying short-term performance. So we can start by confirming that the company has generally done a very good job of growing revenue over that time, even though it had some hiccups along the way.
Comparing that to the industry, which is only predicted to deliver 2.9% growth in the next 12 months, the company's momentum is stronger based on recent medium-term annualised revenue results.
In light of this, it's understandable that Great Harvest Maeta Holdings' P/S sits above the majority of other companies. It seems most investors are expecting this strong growth to continue and are willing to pay more for the stock.
The Key Takeaway
There's still some elevation in Great Harvest Maeta Holdings' P/S, even if the same can't be said for its share price recently. Using the price-to-sales ratio alone to determine if you should sell your stock isn't sensible, however it can be a practical guide to the company's future prospects.
As we suspected, our examination of Great Harvest Maeta Holdings revealed its three-year revenue trends are contributing to its high P/S, given they look better than current industry expectations. At this stage investors feel the potential continued revenue growth in the future is great enough to warrant an inflated P/S. If recent medium-term revenue trends continue, it's hard to see the share price falling strongly in the near future under these circumstances.
Don't forget that there may be other risks. For instance, we've identified 3 warning signs for Great Harvest Maeta Holdings (2 don't sit too well with us) you should be aware of.
It's important to make sure you look for a great company, not just the first idea you come across. So if growing profitability aligns with your idea of a great company, take a peek at this free list of interesting companies with strong recent earnings growth (and a low P/E).
New: Manage All Your Stock Portfolios in One Place
We've created the ultimate portfolio companion for stock investors, and it's free.
• Connect an unlimited number of Portfolios and see your total in one currency
• Be alerted to new Warning Signs or Risks via email or mobile
• Track the Fair Value of your stocks
Have feedback on this article? Concerned about the content? Get in touch with us directly. Alternatively, email editorial-team (at) simplywallst.com.
This article by Simply Wall St is general in nature. We provide commentary based on historical data and analyst forecasts only using an unbiased methodology and our articles are not intended to be financial advice. It does not constitute a recommendation to buy or sell any stock, and does not take account of your objectives, or your financial situation. We aim to bring you long-term focused analysis driven by fundamental data. Note that our analysis may not factor in the latest price-sensitive company announcements or qualitative material. Simply Wall St has no position in any stocks mentioned.
About SEHK:3683
Great Harvest Maeta Holdings
An investment holding company, provides dry bulk vessel chartering services worldwide.
Slightly overvalued with imperfect balance sheet.
Market Insights

Advertisement
Community Narratives

Apple: A Dying Star with an Overpriced Valuation
Fair Value US$177.34|19.7% overvalued
IN
Community Contributor
Avino a case for USD$20 per share within 5 years (assuming $3,500 gold, $100 silver and $4 copper).
Fair Value CA$26.79|87.9% undervalued
AG
Community Contributor
Riding the Defense Boom RENK Sees Revenue Climb at 15% CAGR by FY 2029
Fair Value €69.87|24.5% undervalued
CH
Community Contributor