
Advertisement
- Hong Kong
- /
- Infrastructure
- /
- SEHK:357
Capital Allocation Trends At Hainan Meilan International Airport (HKG:357) Aren't Ideal

When it comes to investing, there are some useful financial metrics that can warn us when a business is potentially in trouble. A business that's potentially in decline often shows two trends, a return on capital employed (ROCE) that's declining, and a base of capital employed that's also declining. This indicates the company is producing less profit from its investments and its total assets are decreasing. So after we looked into Hainan Meilan International Airport (HKG:357), the trends above didn't look too great.
Return On Capital Employed (ROCE): What is it?
If you haven't worked with ROCE before, it measures the 'return' (pre-tax profit) a company generates from capital employed in its business. Analysts use this formula to calculate it for Hainan Meilan International Airport:
Return on Capital Employed = Earnings Before Interest and Tax (EBIT) ÷ (Total Assets - Current Liabilities)
0.07 = CN¥292m ÷ (CN¥11b - CN¥6.9b) (Based on the trailing twelve months to December 2020).
Thus, Hainan Meilan International Airport has an ROCE of 7.0%. Even though it's in line with the industry average of 6.7%, it's still a low return by itself.
See our latest analysis for Hainan Meilan International Airport
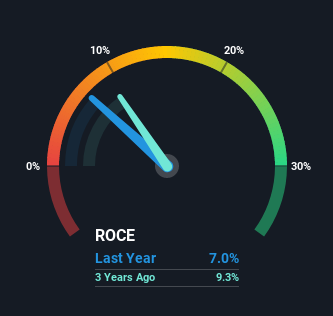
Above you can see how the current ROCE for Hainan Meilan International Airport compares to its prior returns on capital, but there's only so much you can tell from the past. If you'd like to see what analysts are forecasting going forward, you should check out our free report for Hainan Meilan International Airport.
What The Trend Of ROCE Can Tell Us
We are a bit worried about the trend of returns on capital at Hainan Meilan International Airport. About five years ago, returns on capital were 11%, however they're now substantially lower than that as we saw above. And on the capital employed front, the business is utilizing roughly the same amount of capital as it was back then. Since returns are falling and the business has the same amount of assets employed, this can suggest it's a mature business that hasn't had much growth in the last five years. If these trends continue, we wouldn't expect Hainan Meilan International Airport to turn into a multi-bagger.
On a side note, Hainan Meilan International Airport's current liabilities have increased over the last five years to 62% of total assets, effectively distorting the ROCE to some degree. Without this increase, it's likely that ROCE would be even lower than 7.0%. And with current liabilities at these levels, suppliers or short-term creditors are effectively funding a large part of the business, which can introduce some risks.
The Key Takeaway
In summary, it's unfortunate that Hainan Meilan International Airport is generating lower returns from the same amount of capital. Yet despite these poor fundamentals, the stock has gained a huge 325% over the last five years, so investors appear very optimistic. Regardless, we don't feel too comfortable with the fundamentals so we'd be steering clear of this stock for now.
One more thing, we've spotted 1 warning sign facing Hainan Meilan International Airport that you might find interesting.
If you want to search for solid companies with great earnings, check out this free list of companies with good balance sheets and impressive returns on equity.
When trading stocks or any other investment, use the platform considered by many to be the Professional's Gateway to the Worlds Market, Interactive Brokers. You get the lowest-cost* trading on stocks, options, futures, forex, bonds and funds worldwide from a single integrated account. Promoted
Valuation is complex, but we're here to simplify it.
Discover if Hainan Meilan International Airport might be undervalued or overvalued with our detailed analysis, featuring fair value estimates, potential risks, dividends, insider trades, and its financial condition.
Access Free AnalysisThis article by Simply Wall St is general in nature. It does not constitute a recommendation to buy or sell any stock, and does not take account of your objectives, or your financial situation. We aim to bring you long-term focused analysis driven by fundamental data. Note that our analysis may not factor in the latest price-sensitive company announcements or qualitative material. Simply Wall St has no position in any stocks mentioned.
*Interactive Brokers Rated Lowest Cost Broker by StockBrokers.com Annual Online Review 2020
Have feedback on this article? Concerned about the content? Get in touch with us directly. Alternatively, email editorial-team (at) simplywallst.com.
About SEHK:357
Hainan Meilan International Airport
Engages in the aeronautical and non-aeronautical businesses at the Haikou Meilan Airport in the People's Republic of China.
Reasonable growth potential and fair value.
Market Insights

Advertisement
Community Narratives

Apple: A Dying Star with an Overpriced Valuation
Fair Value US$177.34|19.7% overvalued
IN
Community Contributor
Avino a case for USD$20 per share within 5 years (assuming $3,500 gold, $100 silver and $4 copper).
Fair Value CA$26.79|87.9% undervalued
AG
Community Contributor
Riding the Defense Boom RENK Sees Revenue Climb at 15% CAGR by FY 2029
Fair Value €69.87|24.5% undervalued
CH
Community Contributor