- Hong Kong
- /
- Marine and Shipping
- /
- SEHK:351
Asia Energy Logistics Group Limited's (HKG:351) P/S Is Still On The Mark Following 52% Share Price Bounce

Asia Energy Logistics Group Limited (HKG:351) shareholders would be excited to see that the share price has had a great month, posting a 52% gain and recovering from prior weakness. Unfortunately, the gains of the last month did little to right the losses of the last year with the stock still down 43% over that time.
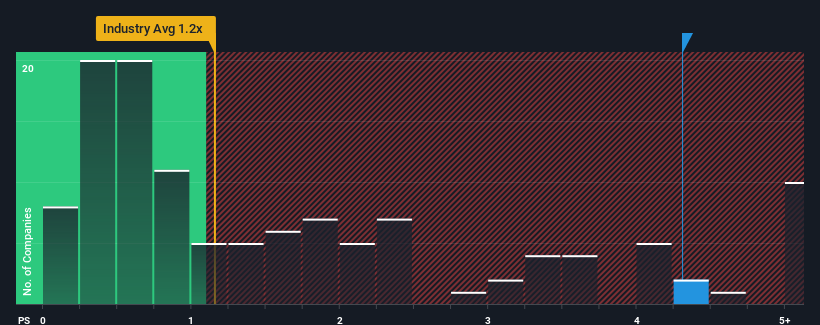
Since its price has surged higher, you could be forgiven for thinking Asia Energy Logistics Group is a stock to steer clear of with a price-to-sales ratios (or "P/S") of 4.3x, considering almost half the companies in Hong Kong's Shipping industry have P/S ratios below 0.7x. Although, it's not wise to just take the P/S at face value as there may be an explanation why it's so lofty.
Check out our latest analysis for Asia Energy Logistics Group

What Does Asia Energy Logistics Group's Recent Performance Look Like?
Asia Energy Logistics Group certainly has been doing a great job lately as it's been growing its revenue at a really rapid pace. It seems that many are expecting the strong revenue performance to beat most other companies over the coming period, which has increased investors’ willingness to pay up for the stock. If not, then existing shareholders might be a little nervous about the viability of the share price.
Although there are no analyst estimates available for Asia Energy Logistics Group, take a look at this free data-rich visualisation to see how the company stacks up on earnings, revenue and cash flow.What Are Revenue Growth Metrics Telling Us About The High P/S?
In order to justify its P/S ratio, Asia Energy Logistics Group would need to produce outstanding growth that's well in excess of the industry.
Retrospectively, the last year delivered an exceptional 65% gain to the company's top line. The latest three year period has also seen an excellent 140% overall rise in revenue, aided by its short-term performance. So we can start by confirming that the company has done a great job of growing revenue over that time.
Weighing the recent medium-term upward revenue trajectory against the broader industry's one-year forecast for contraction of 29% shows it's a great look while it lasts.
With this in mind, it's clear to us why Asia Energy Logistics Group's P/S exceeds that of its industry peers. Presumably shareholders aren't keen to offload something they believe will continue to outmanoeuvre the industry. However, its current revenue trajectory will be very difficult to maintain against the headwinds other companies are facing at the moment.
What Does Asia Energy Logistics Group's P/S Mean For Investors?
The strong share price surge has lead to Asia Energy Logistics Group's P/S soaring as well. It's argued the price-to-sales ratio is an inferior measure of value within certain industries, but it can be a powerful business sentiment indicator.
We see that Asia Energy Logistics Group justifiably maintains its high P/S on the merits of its recentthree-year revenue growth beating forecasts amidst struggling industry. It could be said that investors feel this revenue growth will continue into the future, justifying a higher P/S ratio. We still remain cautious about the company's ability to stay its recent course and swim against the current of the broader industry turmoil. Although, if the company's relative performance doesn't change it will continue to provide strong support to the share price.
Having said that, be aware Asia Energy Logistics Group is showing 3 warning signs in our investment analysis, and 1 of those shouldn't be ignored.
If these risks are making you reconsider your opinion on Asia Energy Logistics Group, explore our interactive list of high quality stocks to get an idea of what else is out there.
If you're looking to trade Asia Energy Logistics Group, open an account with the lowest-cost platform trusted by professionals, Interactive Brokers.
With clients in over 200 countries and territories, and access to 160 markets, IBKR lets you trade stocks, options, futures, forex, bonds and funds from a single integrated account.
Enjoy no hidden fees, no account minimums, and FX conversion rates as low as 0.03%, far better than what most brokers offer.
Sponsored ContentNew: Manage All Your Stock Portfolios in One Place
We've created the ultimate portfolio companion for stock investors, and it's free.
• Connect an unlimited number of Portfolios and see your total in one currency
• Be alerted to new Warning Signs or Risks via email or mobile
• Track the Fair Value of your stocks
Have feedback on this article? Concerned about the content? Get in touch with us directly. Alternatively, email editorial-team (at) simplywallst.com.
This article by Simply Wall St is general in nature. We provide commentary based on historical data and analyst forecasts only using an unbiased methodology and our articles are not intended to be financial advice. It does not constitute a recommendation to buy or sell any stock, and does not take account of your objectives, or your financial situation. We aim to bring you long-term focused analysis driven by fundamental data. Note that our analysis may not factor in the latest price-sensitive company announcements or qualitative material. Simply Wall St has no position in any stocks mentioned.
About SEHK:351
Asia Energy Logistics Group
An investment holding company, provides shipping and logistics services in the People’s Republic of China.
Flawless balance sheet very low.
Market Insights
Community Narratives


