
Advertisement
- Hong Kong
- /
- Marine and Shipping
- /
- SEHK:1919
COSCO SHIPPING Holdings Co., Ltd. (HKG:1919) Shares Could Be 50% Below Their Intrinsic Value Estimate
Key Insights
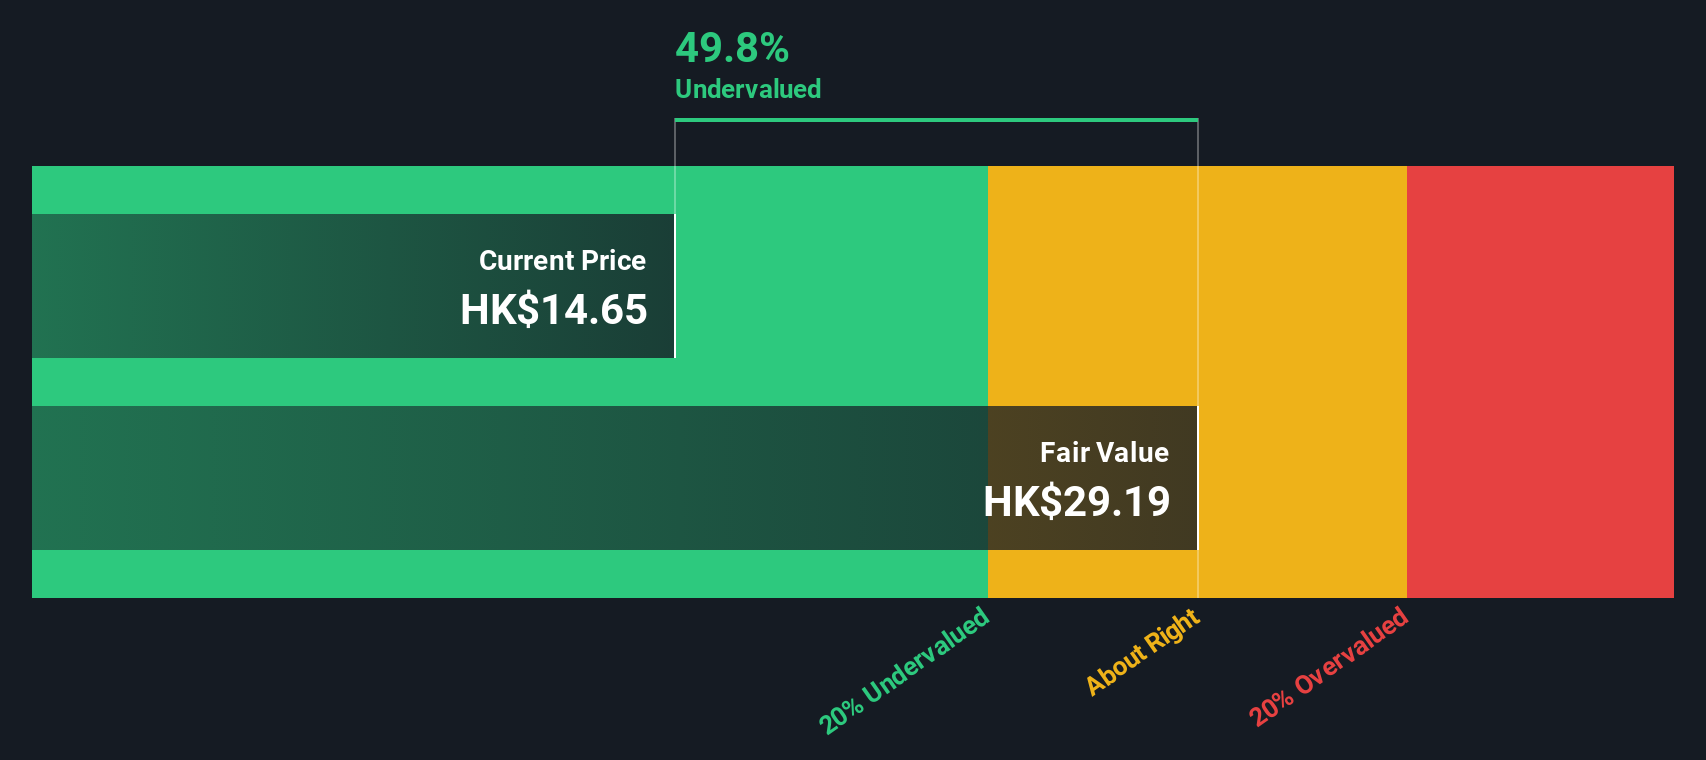
- COSCO SHIPPING Holdings' estimated fair value is HK$29.19 based on 2 Stage Free Cash Flow to Equity
- COSCO SHIPPING Holdings' HK$14.65 share price signals that it might be 50% undervalued
- Analyst price target for 1919 is CN¥12.97 which is 56% below our fair value estimate
Today we will run through one way of estimating the intrinsic value of COSCO SHIPPING Holdings Co., Ltd. (HKG:1919) by taking the expected future cash flows and discounting them to today's value. Our analysis will employ the Discounted Cash Flow (DCF) model. There's really not all that much to it, even though it might appear quite complex.
Companies can be valued in a lot of ways, so we would point out that a DCF is not perfect for every situation. If you still have some burning questions about this type of valuation, take a look at the Simply Wall St analysis model.
Step By Step Through The Calculation
We're using the 2-stage growth model, which simply means we take in account two stages of company's growth. In the initial period the company may have a higher growth rate and the second stage is usually assumed to have a stable growth rate. To begin with, we have to get estimates of the next ten years of cash flows. Where possible we use analyst estimates, but when these aren't available we extrapolate the previous free cash flow (FCF) from the last estimate or reported value. We assume companies with shrinking free cash flow will slow their rate of shrinkage, and that companies with growing free cash flow will see their growth rate slow, over this period. We do this to reflect that growth tends to slow more in the early years than it does in later years.
Generally we assume that a dollar today is more valuable than a dollar in the future, so we discount the value of these future cash flows to their estimated value in today's dollars:
10-year free cash flow (FCF) forecast
| 2026 | 2027 | 2028 | 2029 | 2030 | 2031 | 2032 | 2033 | 2034 | 2035 | |
| Levered FCF (CN¥, Millions) | CN¥28.1b | CN¥32.4b | CN¥28.1b | CN¥25.8b | CN¥24.5b | CN¥23.8b | CN¥23.6b | CN¥23.6b | CN¥23.8b | CN¥24.1b |
| Growth Rate Estimate Source | Analyst x2 | Analyst x2 | Est @ -13.04% | Est @ -8.32% | Est @ -5.02% | Est @ -2.71% | Est @ -1.09% | Est @ 0.05% | Est @ 0.84% | Est @ 1.39% |
| Present Value (CN¥, Millions) Discounted @ 7.8% | CN¥26.1k | CN¥27.9k | CN¥22.5k | CN¥19.1k | CN¥16.9k | CN¥15.2k | CN¥14.0k | CN¥13.0k | CN¥12.1k | CN¥11.4k |
("Est" = FCF growth rate estimated by Simply Wall St)
Present Value of 10-year Cash Flow (PVCF) = CN¥178b
After calculating the present value of future cash flows in the initial 10-year period, we need to calculate the Terminal Value, which accounts for all future cash flows beyond the first stage. For a number of reasons a very conservative growth rate is used that cannot exceed that of a country's GDP growth. In this case we have used the 5-year average of the 10-year government bond yield (2.7%) to estimate future growth. In the same way as with the 10-year 'growth' period, we discount future cash flows to today's value, using a cost of equity of 7.8%.
Terminal Value (TV)= FCF2035 × (1 + g) ÷ (r – g) = CN¥24b× (1 + 2.7%) ÷ (7.8%– 2.7%) = CN¥489b
Present Value of Terminal Value (PVTV)= TV / (1 + r)10= CN¥489b÷ ( 1 + 7.8%)10= CN¥231b
The total value is the sum of cash flows for the next ten years plus the discounted terminal value, which results in the Total Equity Value, which in this case is CN¥410b. To get the intrinsic value per share, we divide this by the total number of shares outstanding. Compared to the current share price of HK$14.7, the company appears quite undervalued at a 50% discount to where the stock price trades currently. Remember though, that this is just an approximate valuation, and like any complex formula - garbage in, garbage out.
The Assumptions
Now the most important inputs to a discounted cash flow are the discount rate, and of course, the actual cash flows. You don't have to agree with these inputs, I recommend redoing the calculations yourself and playing with them. The DCF also does not consider the possible cyclicality of an industry, or a company's future capital requirements, so it does not give a full picture of a company's potential performance. Given that we are looking at COSCO SHIPPING Holdings as potential shareholders, the cost of equity is used as the discount rate, rather than the cost of capital (or weighted average cost of capital, WACC) which accounts for debt. In this calculation we've used 7.8%, which is based on a levered beta of 0.966. Beta is a measure of a stock's volatility, compared to the market as a whole. We get our beta from the industry average beta of globally comparable companies, with an imposed limit between 0.8 and 2.0, which is a reasonable range for a stable business.
Check out our latest analysis for COSCO SHIPPING Holdings
SWOT Analysis for COSCO SHIPPING Holdings
Strength
- Earnings growth over the past year exceeded the industry.
- Debt is not viewed as a risk.
- Dividends are covered by earnings and cash flows.
- Dividend is in the top 25% of dividend payers in the market.
Weakness
- No major weaknesses identified for 1919.
Opportunity
- Good value based on P/E ratio and estimated fair value.
Threat
- Annual earnings are forecast to decline for the next 3 years.
Next Steps:
Although the valuation of a company is important, it is only one of many factors that you need to assess for a company. The DCF model is not a perfect stock valuation tool. Rather it should be seen as a guide to "what assumptions need to be true for this stock to be under/overvalued?" For instance, if the terminal value growth rate is adjusted slightly, it can dramatically alter the overall result. Can we work out why the company is trading at a discount to intrinsic value? For COSCO SHIPPING Holdings, we've put together three further aspects you should consider:
- Risks: We feel that you should assess the 2 warning signs for COSCO SHIPPING Holdings (1 is a bit unpleasant!) we've flagged before making an investment in the company.
- Future Earnings: How does 1919's growth rate compare to its peers and the wider market? Dig deeper into the analyst consensus number for the upcoming years by interacting with our free analyst growth expectation chart.
- Other Solid Businesses: Low debt, high returns on equity and good past performance are fundamental to a strong business. Why not explore our interactive list of stocks with solid business fundamentals to see if there are other companies you may not have considered!
PS. The Simply Wall St app conducts a discounted cash flow valuation for every stock on the SEHK every day. If you want to find the calculation for other stocks just search here.
New: AI Stock Screener & Alerts
Our new AI Stock Screener scans the market every day to uncover opportunities.
• Dividend Powerhouses (3%+ Yield)
• Undervalued Small Caps with Insider Buying
• High growth Tech and AI Companies
Or build your own from over 50 metrics.
Have feedback on this article? Concerned about the content? Get in touch with us directly. Alternatively, email editorial-team (at) simplywallst.com.
This article by Simply Wall St is general in nature. We provide commentary based on historical data and analyst forecasts only using an unbiased methodology and our articles are not intended to be financial advice. It does not constitute a recommendation to buy or sell any stock, and does not take account of your objectives, or your financial situation. We aim to bring you long-term focused analysis driven by fundamental data. Note that our analysis may not factor in the latest price-sensitive company announcements or qualitative material. Simply Wall St has no position in any stocks mentioned.
About SEHK:1919
COSCO SHIPPING Holdings
An investment holding company, engages in the container shipping in the United States, Europe, the Asia Pacific, Mainland China, and internationally.
Flawless balance sheet, good value and pays a dividend.
Similar Companies
Market Insights

Advertisement
Community Narratives
MINISO's fair value is projected at 26.69 with an anticipated PE ratio shift of 20x
Fair Value US$24.03|9.0% undervalued
BE
Community Contributor
Procter & Gamble: A Dividend Giant Facing Slowing Growth
Fair Value US$119.81|23.5% overvalued
AN
Community Contributor
Eli Lilly's Future Growth Driven by Tirzepatide and Favorable Market Conditions
Fair Value US$1.19k|14.4% undervalued
EA
Community Contributor