
Advertisement

If you want to know who really controls Razer Inc. (HKG:1337), then you'll have to look at the makeup of its share registry. Institutions often own shares in more established companies, while it's not unusual to see insiders own a fair bit of smaller companies. Warren Buffett said that he likes 'a business with enduring competitive advantages that is run by able and owner-oriented people'. So it's nice to see some insider ownership, because it may suggest that management is owner-oriented.
Razer has a market capitalization of HK$11b, so we would expect some institutional investors to have noticed the stock. In the chart below, we can see that institutional investors have not yet purchased much of the company. We can zoom in on the different ownership groups, to learn more about Razer.
Check out our latest analysis for Razer
What Does The Institutional Ownership Tell Us About Razer?
Many institutions measure their performance against an index that approximates the local market. So they usually pay more attention to companies that are included in major indices.
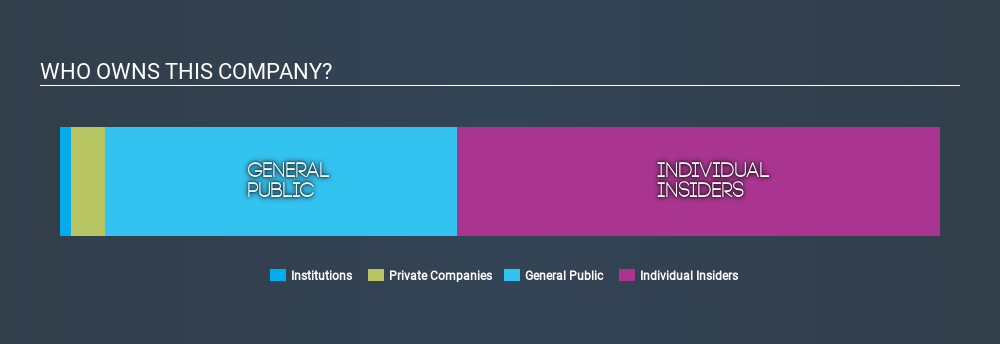
Since institutions own under 5% of Razer, many may not have spent much time considering the stock. But it's clear that some have; and they liked it enough to buy in. If the business gets stronger from here, we could see a situation where more institutions are keen to buy. It is not uncommon to see a big share price rise if multiple institutional investors are trying to buy into a stock at the same time. So check out the historic earnings trajectory, below, but keep in mind it's the future that counts most.

Hedge funds don't have many shares in Razer. With a 34% stake, CEO Min-Liang Tan is the largest shareholder. The second and third largest shareholders are Kaling Lim and Lim Teck Lee (private) Limited, holding 20% and 3.9%, respectively.
Further, we found that the top 2 shareholders have a combined ownership of 53% in the company, meaning that they are powerful enough to influence the decisions of the company.
While studying institutional ownership for a company can add value to your research, It is also a good practice to research analyst recommendations to get a deeper understand of a stock's expected performance. There are plenty of analysts covering the stock, so it might be worth seeing what they are forecasting, too.
Insider Ownership Of Razer
While the precise definition of an insider can be subjective, almost everyone considers board members to be insiders. The company management answer to the board; and the latter should represent the interests of shareholders. Notably, sometimes top-level managers are on the board, themselves.
Most consider insider ownership a positive because it can indicate the board is well aligned with other shareholders. However, on some occasions too much power is concentrated within this group.
Our most recent data indicates that insiders own the majority of Razer Inc.. This means they can collectively make decisions for the company. Given it has a market cap of HK$11b, that means insiders have a whopping HK$6.2b worth of shares in their own names. When analysing a company, looking at ownership may seem a logical place to start. However, there are many other factors to consider, such as the risks within the company itself. For example, we've discovered 2 warning signs for Razer which any shareholder or potential investor should be aware of.
General Public Ownership
With a 40% ownership, the general public have some degree of sway over 1337. While this group can't necessarily call the shots, it can certainly have a real influence on how the company is run.
Private Company Ownership
We can see that Private Companies own 3.9%, of the shares on issue. It might be worth looking deeper into this. If related parties, such as insiders, have an interest in one of these private companies, that should be disclosed in the annual report. Private companies may also have a strategic interest in the company.
Next Steps:
While it is well worth considering the different groups that own a company, there are other factors that are even more important.
I always like to check for a history of revenue growth. You can too, by accessing this free chart of historic revenue and earnings in this detailed graph.
Ultimately the future is most important. You can access this free report on analyst forecasts for the company.
NB: Figures in this article are calculated using data from the last twelve months, which refer to the 12-month period ending on the last date of the month the financial statement is dated. This may not be consistent with full year annual report figures.
If you spot an error that warrants correction, please contact the editor at editorial-team@simplywallst.com. This article by Simply Wall St is general in nature. It does not constitute a recommendation to buy or sell any stock, and does not take account of your objectives, or your financial situation. Simply Wall St has no position in the stocks mentioned.
We aim to bring you long-term focused research analysis driven by fundamental data. Note that our analysis may not factor in the latest price-sensitive company announcements or qualitative material. Thank you for reading.
Market Insights


Advertisement
Community Narratives
Rocket Lab USA Will Ignite a 30% Revenue Growth Journey
Fair Value US$31.72|36.1% undervalued
KI
Community Contributor
EasyJet weirdly unloved by investors in spite of relatively attractive metrics
Fair Value UK£6.95|29.6% undervalued
PI
Community Contributor
HEXPOL AB: Sustained Long Term Growth, Stable Margins, and Strategic M&A
Fair Value SEK 122.27|20.7% undervalued
MA
Community Contributor