Investor Optimism Abounds Tianli Holdings Group Limited (HKG:117) But Growth Is Lacking


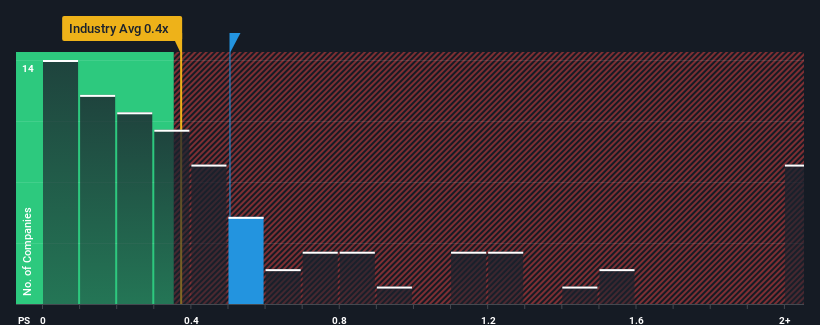
There wouldn't be many who think Tianli Holdings Group Limited's (HKG:117) price-to-sales (or "P/S") ratio of 0.5x is worth a mention when the median P/S for the Electronic industry in Hong Kong is similar at about 0.4x. Although, it's not wise to simply ignore the P/S without explanation as investors may be disregarding a distinct opportunity or a costly mistake.
Check out our latest analysis for Tianli Holdings Group
How Tianli Holdings Group Has Been Performing
For example, consider that Tianli Holdings Group's financial performance has been poor lately as its revenue has been in decline. One possibility is that the P/S is moderate because investors think the company might still do enough to be in line with the broader industry in the near future. If not, then existing shareholders may be a little nervous about the viability of the share price.
Want the full picture on earnings, revenue and cash flow for the company? Then our free report on Tianli Holdings Group will help you shine a light on its historical performance.Do Revenue Forecasts Match The P/S Ratio?
In order to justify its P/S ratio, Tianli Holdings Group would need to produce growth that's similar to the industry.
Taking a look back first, the company's revenue growth last year wasn't something to get excited about as it posted a disappointing decline of 11%. This has soured the latest three-year period, which nevertheless managed to deliver a decent 15% overall rise in revenue. So we can start by confirming that the company has generally done a good job of growing revenue over that time, even though it had some hiccups along the way.
Comparing that to the industry, which is predicted to deliver 13% growth in the next 12 months, the company's momentum is weaker, based on recent medium-term annualised revenue results.
With this in mind, we find it intriguing that Tianli Holdings Group's P/S is comparable to that of its industry peers. Apparently many investors in the company are less bearish than recent times would indicate and aren't willing to let go of their stock right now. They may be setting themselves up for future disappointment if the P/S falls to levels more in line with recent growth rates.
What We Can Learn From Tianli Holdings Group's P/S?
Typically, we'd caution against reading too much into price-to-sales ratios when settling on investment decisions, though it can reveal plenty about what other market participants think about the company.
We've established that Tianli Holdings Group's average P/S is a bit surprising since its recent three-year growth is lower than the wider industry forecast. Right now we are uncomfortable with the P/S as this revenue performance isn't likely to support a more positive sentiment for long. If recent medium-term revenue trends continue, the probability of a share price decline will become quite substantial, placing shareholders at risk.
It is also worth noting that we have found 4 warning signs for Tianli Holdings Group (2 shouldn't be ignored!) that you need to take into consideration.
If these risks are making you reconsider your opinion on Tianli Holdings Group, explore our interactive list of high quality stocks to get an idea of what else is out there.
If you're looking to trade Tianli Holdings Group, open an account with the lowest-cost platform trusted by professionals, Interactive Brokers.
With clients in over 200 countries and territories, and access to 160 markets, IBKR lets you trade stocks, options, futures, forex, bonds and funds from a single integrated account.
Enjoy no hidden fees, no account minimums, and FX conversion rates as low as 0.03%, far better than what most brokers offer.
Sponsored ContentValuation is complex, but we're here to simplify it.
Discover if Tianli Holdings Group might be undervalued or overvalued with our detailed analysis, featuring fair value estimates, potential risks, dividends, insider trades, and its financial condition.
Access Free AnalysisHave feedback on this article? Concerned about the content? Get in touch with us directly. Alternatively, email editorial-team (at) simplywallst.com.
This article by Simply Wall St is general in nature. We provide commentary based on historical data and analyst forecasts only using an unbiased methodology and our articles are not intended to be financial advice. It does not constitute a recommendation to buy or sell any stock, and does not take account of your objectives, or your financial situation. We aim to bring you long-term focused analysis driven by fundamental data. Note that our analysis may not factor in the latest price-sensitive company announcements or qualitative material. Simply Wall St has no position in any stocks mentioned.
About SEHK:117
Tianli Holdings Group
An investment holding company, manufactures and sells multi-layer ceramic capacitors (MLCC) in Mainland China, Hong Kong, and internationally.
Slight and slightly overvalued.

