- Hong Kong
- /
- Diversified Financial
- /
- SEHK:9923
Yeahka (HKG:9923) Is Experiencing Growth In Returns On Capital


If we want to find a stock that could multiply over the long term, what are the underlying trends we should look for? Ideally, a business will show two trends; firstly a growing return on capital employed (ROCE) and secondly, an increasing amount of capital employed. This shows us that it's a compounding machine, able to continually reinvest its earnings back into the business and generate higher returns. Speaking of which, we noticed some great changes in Yeahka's (HKG:9923) returns on capital, so let's have a look.
Understanding Return On Capital Employed (ROCE)
For those who don't know, ROCE is a measure of a company's yearly pre-tax profit (its return), relative to the capital employed in the business. The formula for this calculation on Yeahka is:
Return on Capital Employed = Earnings Before Interest and Tax (EBIT) ÷ (Total Assets - Current Liabilities)
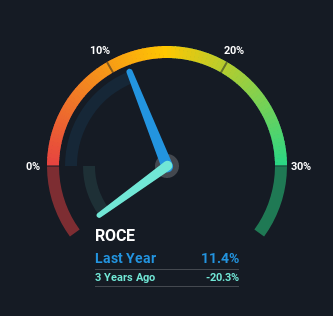
0.11 = CN¥376m ÷ (CN¥5.6b - CN¥2.3b) (Based on the trailing twelve months to December 2020).
Therefore, Yeahka has an ROCE of 11%. In absolute terms, that's a satisfactory return, but compared to the IT industry average of 8.5% it's much better.
See our latest analysis for Yeahka
Above you can see how the current ROCE for Yeahka compares to its prior returns on capital, but there's only so much you can tell from the past. If you'd like, you can check out the forecasts from the analysts covering Yeahka here for free.
What Can We Tell From Yeahka's ROCE Trend?
We're delighted to see that Yeahka is reaping rewards from its investments and is now generating some pre-tax profits. The company was generating losses four years ago, but now it's earning 11% which is a sight for sore eyes. In addition to that, Yeahka is employing 2,312% more capital than previously which is expected of a company that's trying to break into profitability. This can indicate that there's plenty of opportunities to invest capital internally and at ever higher rates, both common traits of a multi-bagger.
One more thing to note, Yeahka has decreased current liabilities to 41% of total assets over this period, which effectively reduces the amount of funding from suppliers or short-term creditors. This tells us that Yeahka has grown its returns without a reliance on increasing their current liabilities, which we're very happy with. Nevertheless, there are some potential risks the company is bearing with current liabilities that high, so just keep that in mind.
The Bottom Line On Yeahka's ROCE
In summary, it's great to see that Yeahka has managed to break into profitability and is continuing to reinvest in its business. And since the stock has fallen 50% over the last year, there might be an opportunity here. So researching this company further and determining whether or not these trends will continue seems justified.
Yeahka does come with some risks though, we found 3 warning signs in our investment analysis, and 1 of those is potentially serious...
While Yeahka may not currently earn the highest returns, we've compiled a list of companies that currently earn more than 25% return on equity. Check out this free list here.
When trading stocks or any other investment, use the platform considered by many to be the Professional's Gateway to the Worlds Market, Interactive Brokers. You get the lowest-cost* trading on stocks, options, futures, forex, bonds and funds worldwide from a single integrated account. Promoted
New: Manage All Your Stock Portfolios in One Place
We've created the ultimate portfolio companion for stock investors, and it's free.
• Connect an unlimited number of Portfolios and see your total in one currency
• Be alerted to new Warning Signs or Risks via email or mobile
• Track the Fair Value of your stocks
This article by Simply Wall St is general in nature. We provide commentary based on historical data and analyst forecasts only using an unbiased methodology and our articles are not intended to be financial advice. It does not constitute a recommendation to buy or sell any stock, and does not take account of your objectives, or your financial situation. We aim to bring you long-term focused analysis driven by fundamental data. Note that our analysis may not factor in the latest price-sensitive company announcements or qualitative material. Simply Wall St has no position in any stocks mentioned.
*Interactive Brokers Rated Lowest Cost Broker by StockBrokers.com Annual Online Review 2020
Have feedback on this article? Concerned about the content? Get in touch with us directly. Alternatively, email editorial-team (at) simplywallst.com.
About SEHK:9923
Yeahka
An investment holding company, provides payment and business services to merchants and consumers in the People’s Republic of China.
Very undervalued with reasonable growth potential.
Similar Companies
Market Insights

Community Narratives
