
Advertisement
Investors Don't See Light At End Of Future Data Group Limited's (HKG:8229) Tunnel And Push Stock Down 32%
The Future Data Group Limited (HKG:8229) share price has fared very poorly over the last month, falling by a substantial 32%. Instead of being rewarded, shareholders who have already held through the last twelve months are now sitting on a 40% share price drop.
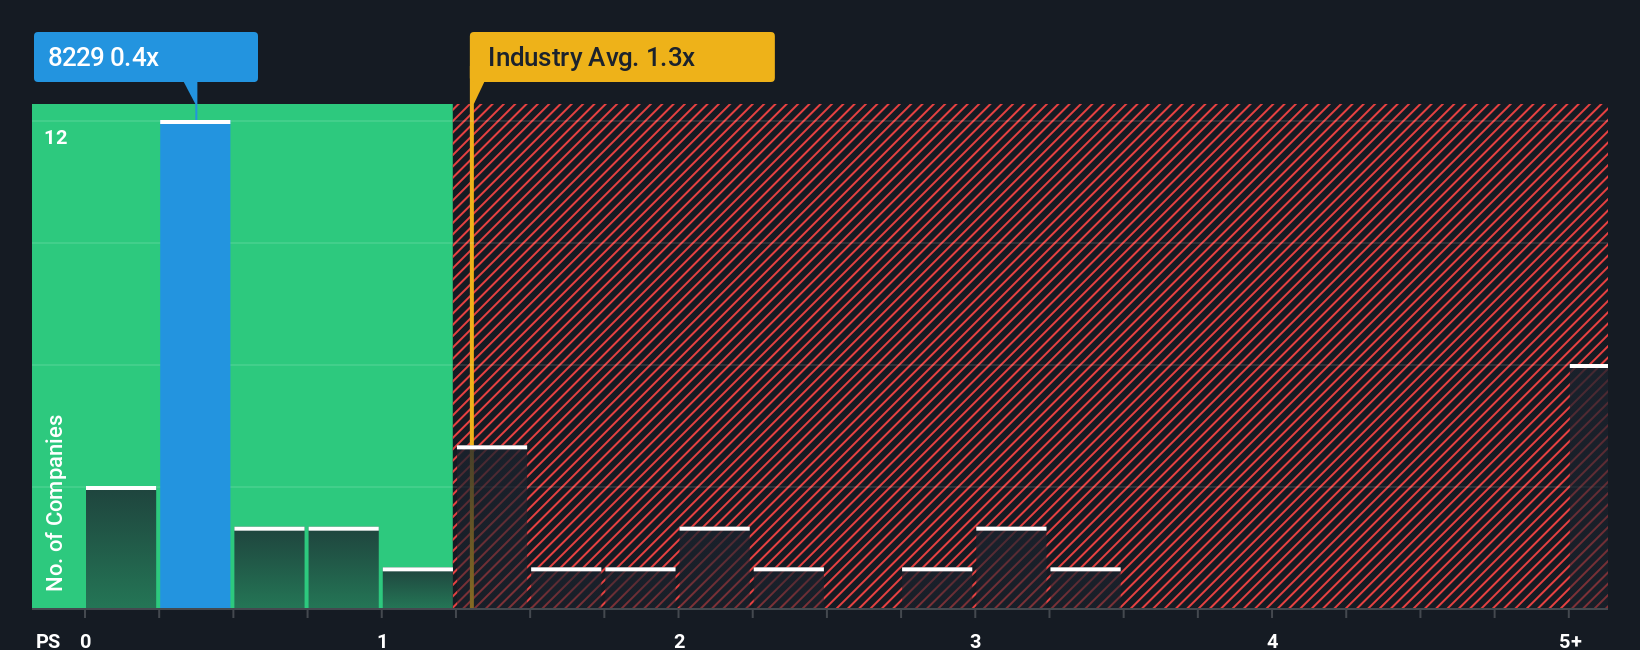
Since its price has dipped substantially, when close to half the companies operating in Hong Kong's IT industry have price-to-sales ratios (or "P/S") above 1.3x, you may consider Future Data Group as an enticing stock to check out with its 0.4x P/S ratio. Nonetheless, we'd need to dig a little deeper to determine if there is a rational basis for the reduced P/S.
See our latest analysis for Future Data Group
What Does Future Data Group's Recent Performance Look Like?
For instance, Future Data Group's receding revenue in recent times would have to be some food for thought. It might be that many expect the disappointing revenue performance to continue or accelerate, which has repressed the P/S. However, if this doesn't eventuate then existing shareholders may be feeling optimistic about the future direction of the share price.
We don't have analyst forecasts, but you can see how recent trends are setting up the company for the future by checking out our free report on Future Data Group's earnings, revenue and cash flow.Do Revenue Forecasts Match The Low P/S Ratio?
The only time you'd be truly comfortable seeing a P/S as low as Future Data Group's is when the company's growth is on track to lag the industry.
Taking a look back first, the company's revenue growth last year wasn't something to get excited about as it posted a disappointing decline of 3.5%. This means it has also seen a slide in revenue over the longer-term as revenue is down 39% in total over the last three years. So unfortunately, we have to acknowledge that the company has not done a great job of growing revenue over that time.
Weighing that medium-term revenue trajectory against the broader industry's one-year forecast for expansion of 8.3% shows it's an unpleasant look.
In light of this, it's understandable that Future Data Group's P/S would sit below the majority of other companies. However, we think shrinking revenues are unlikely to lead to a stable P/S over the longer term, which could set up shareholders for future disappointment. Even just maintaining these prices could be difficult to achieve as recent revenue trends are already weighing down the shares.
The Bottom Line On Future Data Group's P/S
The southerly movements of Future Data Group's shares means its P/S is now sitting at a pretty low level. Generally, our preference is to limit the use of the price-to-sales ratio to establishing what the market thinks about the overall health of a company.
As we suspected, our examination of Future Data Group revealed its shrinking revenue over the medium-term is contributing to its low P/S, given the industry is set to grow. Right now shareholders are accepting the low P/S as they concede future revenue probably won't provide any pleasant surprises either. Unless the recent medium-term conditions improve, they will continue to form a barrier for the share price around these levels.
There are also other vital risk factors to consider and we've discovered 3 warning signs for Future Data Group (1 can't be ignored!) that you should be aware of before investing here.
Of course, profitable companies with a history of great earnings growth are generally safer bets. So you may wish to see this free collection of other companies that have reasonable P/E ratios and have grown earnings strongly.
New: AI Stock Screener & Alerts
Our new AI Stock Screener scans the market every day to uncover opportunities.
• Dividend Powerhouses (3%+ Yield)
• Undervalued Small Caps with Insider Buying
• High growth Tech and AI Companies
Or build your own from over 50 metrics.
Have feedback on this article? Concerned about the content? Get in touch with us directly. Alternatively, email editorial-team (at) simplywallst.com.
This article by Simply Wall St is general in nature. We provide commentary based on historical data and analyst forecasts only using an unbiased methodology and our articles are not intended to be financial advice. It does not constitute a recommendation to buy or sell any stock, and does not take account of your objectives, or your financial situation. We aim to bring you long-term focused analysis driven by fundamental data. Note that our analysis may not factor in the latest price-sensitive company announcements or qualitative material. Simply Wall St has no position in any stocks mentioned.
About SEHK:8229
Future Data Group
An investment holding company, provides system integration and maintenance services in South Korea and Hong Kong.
Adequate balance sheet with low risk.
Market Insights

Advertisement
Weekly Picks
RO


RockeTeller on Santacruz Silver Mining ·
Crazy Undervalued 42 Baggers Silver Play (Active & Running Mine)
Fair Value:CA$8696.7% undervalued
51 followersusers have followed this narrative
6 commentsusers have commented on this narrative
16 likesusers have liked this narrative
RO


Robbo on Fiducian Group ·
Fiducian: Compliance Clouds or Value Opportunity?
Fair Value:AU$122.0% undervalued
7 followersusers have followed this narrative
0 commentsusers have commented on this narrative
0 likesusers have liked this narrative
WO

woodworthfund on Willamette Valley Vineyards ·
Willamette Valley Vineyards (WVVI): Not-So-Great Value
Fair Value:US$247.5% overvalued
9 followersusers have followed this narrative
0 commentsusers have commented on this narrative
1 likeusers have liked this narrative
Recently Updated Narratives
IN

IncomeAssets on Pulse Seismic ·
Watch Pulse Seismic Outperform with 13.6% Revenue Growth in the Coming Years
Fair Value:CA$4.4729.5% undervalued
3 followersusers have followed this narrative
0 commentsusers have commented on this narrative
0 likesusers have liked this narrative
VL

Vladislav on Galleon Gold ·
Significantly undervalued gold explorer in Timmins, finally getting traction
Fair Value:CA$482.8% undervalued
5 followersusers have followed this narrative
0 commentsusers have commented on this narrative
0 likesusers have liked this narrative
FU

FundamentallySarcastic on Credit Corp Group ·
Moderation and Stabilisation: HOLD: Fair Price based on a 4-year Cycle is $12.08
Fair Value:AU$12.6410.8% overvalued
5 followersusers have followed this narrative
0 commentsusers have commented on this narrative
0 likesusers have liked this narrative
Popular Narratives
TH


TheWallstreetKing on MicroVision ·
MicroVision will explode future revenue by 380.37% with a vision towards success
Fair Value:US$6098.5% undervalued
116 followersusers have followed this narrative
11 commentsusers have commented on this narrative
22 likesusers have liked this narrative
AN


AnalystConsensusTarget on NVIDIA ·
NVDA: Expanding AI Demand Will Drive Major Data Center Investments Through 2026
Fair Value:US$250.3926.8% undervalued
957 followersusers have followed this narrative
6 commentsusers have commented on this narrative
25 likesusers have liked this narrative
AN

AnalystConsensusTarget on Alphabet ·
GOOGL: AI Platform Expansion And Cloud Demand Will Support Durable Performance Amid Competitive Pressures
Fair Value:US$323.71.9% undervalued
1342 followersusers have followed this narrative
0 commentsusers have commented on this narrative
17 likesusers have liked this narrative

