
Advertisement
China ITS (Holdings) Co., Ltd.'s (HKG:1900) Price Is Right But Growth Is Lacking After Shares Rocket 27%
China ITS (Holdings) Co., Ltd. (HKG:1900) shares have continued their recent momentum with a 27% gain in the last month alone. Unfortunately, despite the strong performance over the last month, the full year gain of 2.4% isn't as attractive.
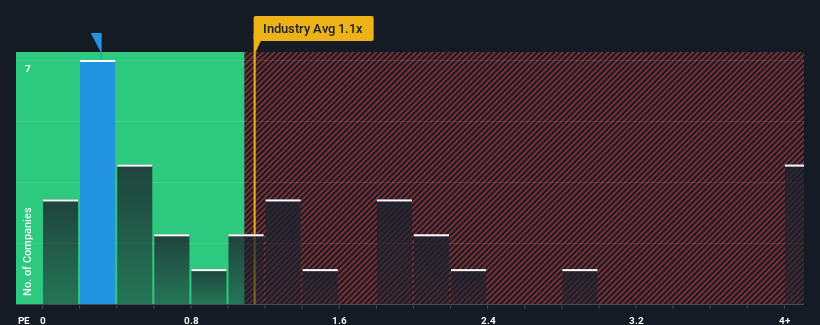
In spite of the firm bounce in price, given about half the companies operating in Hong Kong's IT industry have price-to-sales ratios (or "P/S") above 1.1x, you may still consider China ITS (Holdings) as an attractive investment with its 0.3x P/S ratio. Although, it's not wise to just take the P/S at face value as there may be an explanation why it's limited.
View our latest analysis for China ITS (Holdings)
What Does China ITS (Holdings)'s Recent Performance Look Like?
Revenue has risen firmly for China ITS (Holdings) recently, which is pleasing to see. It might be that many expect the respectable revenue performance to degrade substantially, which has repressed the P/S. Those who are bullish on China ITS (Holdings) will be hoping that this isn't the case, so that they can pick up the stock at a lower valuation.
We don't have analyst forecasts, but you can see how recent trends are setting up the company for the future by checking out our free report on China ITS (Holdings)'s earnings, revenue and cash flow.Is There Any Revenue Growth Forecasted For China ITS (Holdings)?
China ITS (Holdings)'s P/S ratio would be typical for a company that's only expected to deliver limited growth, and importantly, perform worse than the industry.
If we review the last year of revenue growth, the company posted a terrific increase of 20%. However, this wasn't enough as the latest three year period has seen the company endure a nasty 7.9% drop in revenue in aggregate. Accordingly, shareholders would have felt downbeat about the medium-term rates of revenue growth.
In contrast to the company, the rest of the industry is expected to grow by 15% over the next year, which really puts the company's recent medium-term revenue decline into perspective.
With this in mind, we understand why China ITS (Holdings)'s P/S is lower than most of its industry peers. Nonetheless, there's no guarantee the P/S has reached a floor yet with revenue going in reverse. There's potential for the P/S to fall to even lower levels if the company doesn't improve its top-line growth.
The Bottom Line On China ITS (Holdings)'s P/S
The latest share price surge wasn't enough to lift China ITS (Holdings)'s P/S close to the industry median. Typically, we'd caution against reading too much into price-to-sales ratios when settling on investment decisions, though it can reveal plenty about what other market participants think about the company.
Our examination of China ITS (Holdings) confirms that the company's shrinking revenue over the past medium-term is a key factor in its low price-to-sales ratio, given the industry is projected to grow. At this stage investors feel the potential for an improvement in revenue isn't great enough to justify a higher P/S ratio. If recent medium-term revenue trends continue, it's hard to see the share price moving strongly in either direction in the near future under these circumstances.
Before you take the next step, you should know about the 3 warning signs for China ITS (Holdings) that we have uncovered.
It's important to make sure you look for a great company, not just the first idea you come across. So if growing profitability aligns with your idea of a great company, take a peek at this free list of interesting companies with strong recent earnings growth (and a low P/E).
New: AI Stock Screener & Alerts
Our new AI Stock Screener scans the market every day to uncover opportunities.
• Dividend Powerhouses (3%+ Yield)
• Undervalued Small Caps with Insider Buying
• High growth Tech and AI Companies
Or build your own from over 50 metrics.
Have feedback on this article? Concerned about the content? Get in touch with us directly. Alternatively, email editorial-team (at) simplywallst.com.
This article by Simply Wall St is general in nature. We provide commentary based on historical data and analyst forecasts only using an unbiased methodology and our articles are not intended to be financial advice. It does not constitute a recommendation to buy or sell any stock, and does not take account of your objectives, or your financial situation. We aim to bring you long-term focused analysis driven by fundamental data. Note that our analysis may not factor in the latest price-sensitive company announcements or qualitative material. Simply Wall St has no position in any stocks mentioned.
About SEHK:1900
China ITS (Holdings)
An investment holding company, provides products, specialized solutions, and services related to infrastructure technology in the People’s Republic of China and internationally.
Flawless balance sheet with solid track record.
Market Insights

Advertisement
Community Narratives
Finding The True Value Of A Logistics Powerhouse
Fair Value US$95.21|8.5% undervalued
NV
Community Contributor
Paradigm Biopharmaceuticals Will Lead Osteoarthritis Treatment with Zilosul's FDA Success
Fair Value AU$5.50|91.8% undervalued
AM
Community Contributor
Barrick Mining (ABX:CA): A Gold Hedge against a U.S. Shutdown
Fair Value CA$60.00|26.5% undervalued
GM
Community Contributor