
Advertisement
- Hong Kong
- /
- Semiconductors
- /
- SEHK:1385
Market Cool On Shanghai Fudan Microelectronics Group Company Limited's (HKG:1385) Earnings Pushing Shares 26% Lower

The Shanghai Fudan Microelectronics Group Company Limited (HKG:1385) share price has fared very poorly over the last month, falling by a substantial 26%. The recent drop completes a disastrous twelve months for shareholders, who are sitting on a 66% loss during that time.
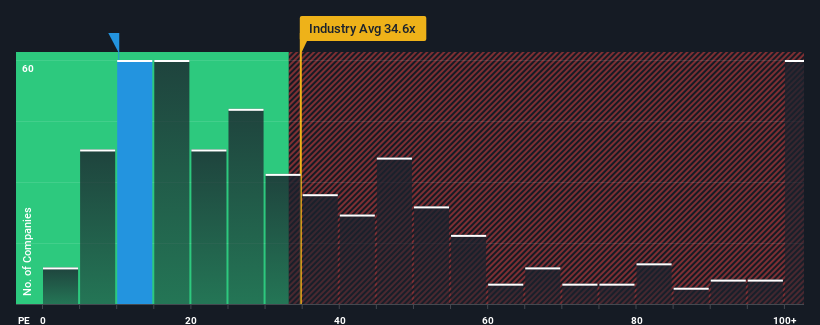
Although its price has dipped substantially, you could still be forgiven for feeling indifferent about Shanghai Fudan Microelectronics Group's P/E ratio of 10.1x, since the median price-to-earnings (or "P/E") ratio in Hong Kong is also close to 9x. While this might not raise any eyebrows, if the P/E ratio is not justified investors could be missing out on a potential opportunity or ignoring looming disappointment.
While the market has experienced earnings growth lately, Shanghai Fudan Microelectronics Group's earnings have gone into reverse gear, which is not great. One possibility is that the P/E is moderate because investors think this poor earnings performance will turn around. If not, then existing shareholders may be a little nervous about the viability of the share price.
See our latest analysis for Shanghai Fudan Microelectronics Group
What Are Growth Metrics Telling Us About The P/E?
There's an inherent assumption that a company should be matching the market for P/E ratios like Shanghai Fudan Microelectronics Group's to be considered reasonable.
If we review the last year of earnings, dishearteningly the company's profits fell to the tune of 33%. However, a few very strong years before that means that it was still able to grow EPS by an impressive 359% in total over the last three years. So we can start by confirming that the company has generally done a very good job of growing earnings over that time, even though it had some hiccups along the way.
Turning to the outlook, the next year should generate growth of 61% as estimated by the two analysts watching the company. With the market only predicted to deliver 21%, the company is positioned for a stronger earnings result.
With this information, we find it interesting that Shanghai Fudan Microelectronics Group is trading at a fairly similar P/E to the market. It may be that most investors aren't convinced the company can achieve future growth expectations.
The Bottom Line On Shanghai Fudan Microelectronics Group's P/E
Following Shanghai Fudan Microelectronics Group's share price tumble, its P/E is now hanging on to the median market P/E. Generally, our preference is to limit the use of the price-to-earnings ratio to establishing what the market thinks about the overall health of a company.
We've established that Shanghai Fudan Microelectronics Group currently trades on a lower than expected P/E since its forecast growth is higher than the wider market. When we see a strong earnings outlook with faster-than-market growth, we assume potential risks are what might be placing pressure on the P/E ratio. It appears some are indeed anticipating earnings instability, because these conditions should normally provide a boost to the share price.
You should always think about risks. Case in point, we've spotted 3 warning signs for Shanghai Fudan Microelectronics Group you should be aware of, and 1 of them is concerning.
If you're unsure about the strength of Shanghai Fudan Microelectronics Group's business, why not explore our interactive list of stocks with solid business fundamentals for some other companies you may have missed.
New: Manage All Your Stock Portfolios in One Place
We've created the ultimate portfolio companion for stock investors, and it's free.
• Connect an unlimited number of Portfolios and see your total in one currency
• Be alerted to new Warning Signs or Risks via email or mobile
• Track the Fair Value of your stocks
Have feedback on this article? Concerned about the content? Get in touch with us directly. Alternatively, email editorial-team (at) simplywallst.com.
This article by Simply Wall St is general in nature. We provide commentary based on historical data and analyst forecasts only using an unbiased methodology and our articles are not intended to be financial advice. It does not constitute a recommendation to buy or sell any stock, and does not take account of your objectives, or your financial situation. We aim to bring you long-term focused analysis driven by fundamental data. Note that our analysis may not factor in the latest price-sensitive company announcements or qualitative material. Simply Wall St has no position in any stocks mentioned.
About SEHK:1385
Shanghai Fudan Microelectronics Group
Engages in the design, development, and sale of integrated circuit products and total solutions in Mainland China and internationally.
Excellent balance sheet with reasonable growth potential.
Similar Companies
Market Insights


Advertisement
Community Narratives
Pole position to benefit from GENIUS Act
Fair Value US$233.04|58.8% undervalued
CH
Community Contributor
IREN will transform from bitcoin miner to leader in AI infrastructure
Fair Value US$21.48|17.5% undervalued
KA
Community Contributor
Behind the Assay: XRF Scientific’s Role in Modern Mining Economics
Fair Value AU$2.10|2.4% undervalued
RO
Community Contributor