
Advertisement
- Hong Kong
- /
- Specialty Stores
- /
- SEHK:8418
Optima Automobile Group Holdings Limited's (HKG:8418) P/S Is Still On The Mark Following 38% Share Price Bounce
Optima Automobile Group Holdings Limited (HKG:8418) shareholders have had their patience rewarded with a 38% share price jump in the last month. The bad news is that even after the stocks recovery in the last 30 days, shareholders are still underwater by about 9.7% over the last year.
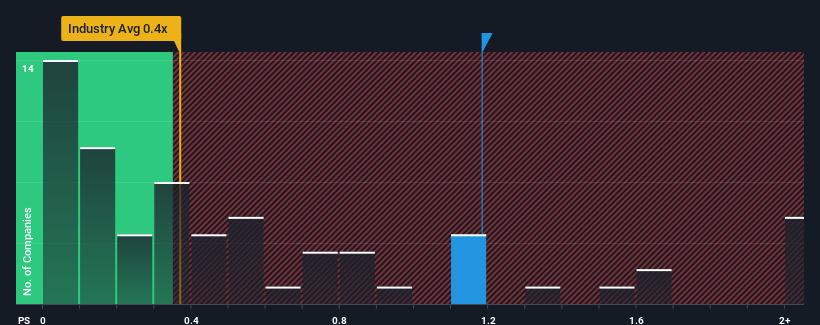
After such a large jump in price, when almost half of the companies in Hong Kong's Specialty Retail industry have price-to-sales ratios (or "P/S") below 0.4x, you may consider Optima Automobile Group Holdings as a stock probably not worth researching with its 1.2x P/S ratio. However, the P/S might be high for a reason and it requires further investigation to determine if it's justified.
See our latest analysis for Optima Automobile Group Holdings
What Does Optima Automobile Group Holdings' Recent Performance Look Like?
The revenue growth achieved at Optima Automobile Group Holdings over the last year would be more than acceptable for most companies. It might be that many expect the respectable revenue performance to beat most other companies over the coming period, which has increased investors’ willingness to pay up for the stock. You'd really hope so, otherwise you're paying a pretty hefty price for no particular reason.
We don't have analyst forecasts, but you can see how recent trends are setting up the company for the future by checking out our free report on Optima Automobile Group Holdings' earnings, revenue and cash flow.What Are Revenue Growth Metrics Telling Us About The High P/S?
The only time you'd be truly comfortable seeing a P/S as high as Optima Automobile Group Holdings' is when the company's growth is on track to outshine the industry.
Taking a look back first, we see that the company grew revenue by an impressive 29% last year. Spectacularly, three year revenue growth has ballooned by several orders of magnitude, thanks in part to the last 12 months of revenue growth. Therefore, it's fair to say the revenue growth recently has been superb for the company.
Comparing that to the industry, which is only predicted to deliver 15% growth in the next 12 months, the company's momentum is stronger based on recent medium-term annualised revenue results.
In light of this, it's understandable that Optima Automobile Group Holdings' P/S sits above the majority of other companies. Presumably shareholders aren't keen to offload something they believe will continue to outmanoeuvre the wider industry.
What Does Optima Automobile Group Holdings' P/S Mean For Investors?
Optima Automobile Group Holdings shares have taken a big step in a northerly direction, but its P/S is elevated as a result. Generally, our preference is to limit the use of the price-to-sales ratio to establishing what the market thinks about the overall health of a company.
As we suspected, our examination of Optima Automobile Group Holdings revealed its three-year revenue trends are contributing to its high P/S, given they look better than current industry expectations. In the eyes of shareholders, the probability of a continued growth trajectory is great enough to prevent the P/S from pulling back. Barring any significant changes to the company's ability to make money, the share price should continue to be propped up.
It's always necessary to consider the ever-present spectre of investment risk. We've identified 3 warning signs with Optima Automobile Group Holdings (at least 1 which can't be ignored), and understanding these should be part of your investment process.
Of course, profitable companies with a history of great earnings growth are generally safer bets. So you may wish to see this free collection of other companies that have reasonable P/E ratios and have grown earnings strongly.
New: AI Stock Screener & Alerts
Our new AI Stock Screener scans the market every day to uncover opportunities.
• Dividend Powerhouses (3%+ Yield)
• Undervalued Small Caps with Insider Buying
• High growth Tech and AI Companies
Or build your own from over 50 metrics.
Have feedback on this article? Concerned about the content? Get in touch with us directly. Alternatively, email editorial-team (at) simplywallst.com.
This article by Simply Wall St is general in nature. We provide commentary based on historical data and analyst forecasts only using an unbiased methodology and our articles are not intended to be financial advice. It does not constitute a recommendation to buy or sell any stock, and does not take account of your objectives, or your financial situation. We aim to bring you long-term focused analysis driven by fundamental data. Note that our analysis may not factor in the latest price-sensitive company announcements or qualitative material. Simply Wall St has no position in any stocks mentioned.
About SEHK:8418
Optima Automobile Group Holdings
An investment holding company, provides after-market automotive services in Singapore and the People’s Republic of China.
Excellent balance sheet with very low risk.
Market Insights

Advertisement
Weekly Picks
RO


RockeTeller on Santacruz Silver Mining ·
Crazy Undervalued 42 Baggers Silver Play (Active & Running Mine)
Fair Value:CA$8696.7% undervalued
50 followersusers have followed this narrative
6 commentsusers have commented on this narrative
16 likesusers have liked this narrative
RO


Robbo on Fiducian Group ·
Fiducian: Compliance Clouds or Value Opportunity?
Fair Value:AU$122.0% undervalued
7 followersusers have followed this narrative
0 commentsusers have commented on this narrative
0 likesusers have liked this narrative
WO

woodworthfund on Willamette Valley Vineyards ·
Willamette Valley Vineyards (WVVI): Not-So-Great Value
Fair Value:US$247.5% overvalued
10 followersusers have followed this narrative
0 commentsusers have commented on this narrative
1 likeusers have liked this narrative
Recently Updated Narratives
IN

IncomeAssets on Pulse Seismic ·
Watch Pulse Seismic Outperform with 13.6% Revenue Growth in the Coming Years
Fair Value:CA$4.4729.5% undervalued
3 followersusers have followed this narrative
0 commentsusers have commented on this narrative
0 likesusers have liked this narrative
VL

Vladislav on Galleon Gold ·
Significantly undervalued gold explorer in Timmins, finally getting traction
Fair Value:CA$482.8% undervalued
6 followersusers have followed this narrative
0 commentsusers have commented on this narrative
0 likesusers have liked this narrative
FU

FundamentallySarcastic on Credit Corp Group ·
Moderation and Stabilisation: HOLD: Fair Price based on a 4-year Cycle is $12.08
Fair Value:AU$12.6410.8% overvalued
6 followersusers have followed this narrative
0 commentsusers have commented on this narrative
0 likesusers have liked this narrative
Popular Narratives
TH


TheWallstreetKing on MicroVision ·
MicroVision will explode future revenue by 380.37% with a vision towards success
Fair Value:US$6098.5% undervalued
116 followersusers have followed this narrative
11 commentsusers have commented on this narrative
22 likesusers have liked this narrative
AN


AnalystConsensusTarget on NVIDIA ·
NVDA: Expanding AI Demand Will Drive Major Data Center Investments Through 2026
Fair Value:US$250.3926.8% undervalued
957 followersusers have followed this narrative
6 commentsusers have commented on this narrative
25 likesusers have liked this narrative
AN

AnalystConsensusTarget on Alphabet ·
GOOGL: AI Platform Expansion And Cloud Demand Will Support Durable Performance Amid Competitive Pressures
Fair Value:US$323.71.9% undervalued
1341 followersusers have followed this narrative
0 commentsusers have commented on this narrative
17 likesusers have liked this narrative

