
Advertisement
- Hong Kong
- /
- Specialty Stores
- /
- SEHK:84
There's Reason For Concern Over Stelux Holdings International Limited's (HKG:84) Massive 30% Price Jump

Stelux Holdings International Limited (HKG:84) shares have had a really impressive month, gaining 30% after a shaky period beforehand. The last 30 days bring the annual gain to a very sharp 60%.
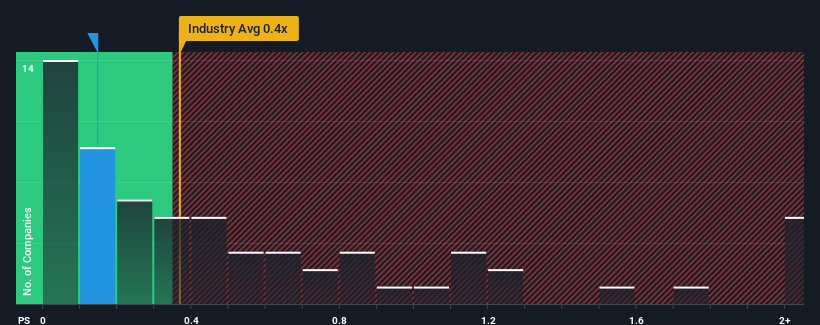
Even after such a large jump in price, you could still be forgiven for feeling indifferent about Stelux Holdings International's P/S ratio of 0.1x, since the median price-to-sales (or "P/S") ratio for the Specialty Retail industry in Hong Kong is also close to 0.4x. While this might not raise any eyebrows, if the P/S ratio is not justified investors could be missing out on a potential opportunity or ignoring looming disappointment.
See our latest analysis for Stelux Holdings International
How Has Stelux Holdings International Performed Recently?
For example, consider that Stelux Holdings International's financial performance has been poor lately as its revenue has been in decline. Perhaps investors believe the recent revenue performance is enough to keep in line with the industry, which is keeping the P/S from dropping off. If not, then existing shareholders may be a little nervous about the viability of the share price.
We don't have analyst forecasts, but you can see how recent trends are setting up the company for the future by checking out our free report on Stelux Holdings International's earnings, revenue and cash flow.Do Revenue Forecasts Match The P/S Ratio?
The only time you'd be comfortable seeing a P/S like Stelux Holdings International's is when the company's growth is tracking the industry closely.
Retrospectively, the last year delivered a frustrating 3.7% decrease to the company's top line. At least revenue has managed not to go completely backwards from three years ago in aggregate, thanks to the earlier period of growth. So it appears to us that the company has had a mixed result in terms of growing revenue over that time.
Comparing that to the industry, which is predicted to deliver 15% growth in the next 12 months, the company's momentum is weaker, based on recent medium-term annualised revenue results.
With this in mind, we find it intriguing that Stelux Holdings International's P/S is comparable to that of its industry peers. Apparently many investors in the company are less bearish than recent times would indicate and aren't willing to let go of their stock right now. They may be setting themselves up for future disappointment if the P/S falls to levels more in line with recent growth rates.
What Does Stelux Holdings International's P/S Mean For Investors?
Stelux Holdings International appears to be back in favour with a solid price jump bringing its P/S back in line with other companies in the industry While the price-to-sales ratio shouldn't be the defining factor in whether you buy a stock or not, it's quite a capable barometer of revenue expectations.
We've established that Stelux Holdings International's average P/S is a bit surprising since its recent three-year growth is lower than the wider industry forecast. Right now we are uncomfortable with the P/S as this revenue performance isn't likely to support a more positive sentiment for long. Unless there is a significant improvement in the company's medium-term performance, it will be difficult to prevent the P/S ratio from declining to a more reasonable level.
It is also worth noting that we have found 1 warning sign for Stelux Holdings International that you need to take into consideration.
Of course, profitable companies with a history of great earnings growth are generally safer bets. So you may wish to see this free collection of other companies that have reasonable P/E ratios and have grown earnings strongly.
New: Manage All Your Stock Portfolios in One Place
We've created the ultimate portfolio companion for stock investors, and it's free.
• Connect an unlimited number of Portfolios and see your total in one currency
• Be alerted to new Warning Signs or Risks via email or mobile
• Track the Fair Value of your stocks
Have feedback on this article? Concerned about the content? Get in touch with us directly. Alternatively, email editorial-team (at) simplywallst.com.
This article by Simply Wall St is general in nature. We provide commentary based on historical data and analyst forecasts only using an unbiased methodology and our articles are not intended to be financial advice. It does not constitute a recommendation to buy or sell any stock, and does not take account of your objectives, or your financial situation. We aim to bring you long-term focused analysis driven by fundamental data. Note that our analysis may not factor in the latest price-sensitive company announcements or qualitative material. Simply Wall St has no position in any stocks mentioned.
About SEHK:84
Stelux Holdings International
An investment holding company, engages in the wholesale and retail of watches.
Acceptable track record with mediocre balance sheet.
Market Insights

Advertisement
Community Narratives

Apple: A Dying Star with an Overpriced Valuation
Fair Value US$177.34|19.7% overvalued
IN
Community Contributor
Avino a case for USD$20 per share within 5 years (assuming $3,500 gold, $100 silver and $4 copper).
Fair Value CA$26.79|87.9% undervalued
AG
Community Contributor
Riding the Defense Boom RENK Sees Revenue Climb at 15% CAGR by FY 2029
Fair Value €69.87|24.5% undervalued
CH
Community Contributor