
Advertisement
- Hong Kong
- /
- Retail Distributors
- /
- SEHK:8179
Market Participants Recognise Palinda Group Holdings Limited's (HKG:8179) Revenues

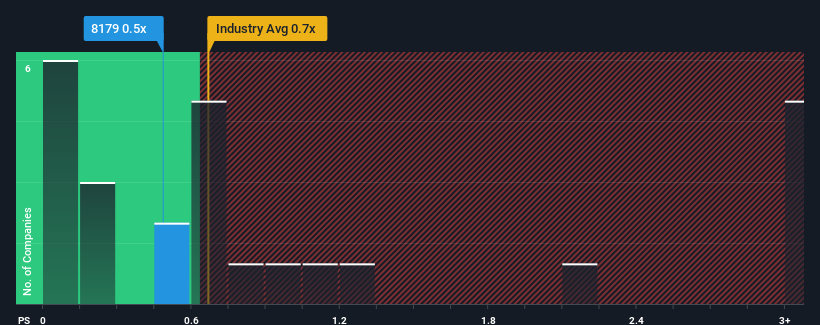
With a median price-to-sales (or "P/S") ratio of close to 0.7x in the Retail Distributors industry in Hong Kong, you could be forgiven for feeling indifferent about Palinda Group Holdings Limited's (HKG:8179) P/S ratio of 0.5x. Although, it's not wise to simply ignore the P/S without explanation as investors may be disregarding a distinct opportunity or a costly mistake.
See our latest analysis for Palinda Group Holdings
How Has Palinda Group Holdings Performed Recently?
As an illustration, revenue has deteriorated at Palinda Group Holdings over the last year, which is not ideal at all. It might be that many expect the company to put the disappointing revenue performance behind them over the coming period, which has kept the P/S from falling. If you like the company, you'd at least be hoping this is the case so that you could potentially pick up some stock while it's not quite in favour.
Want the full picture on earnings, revenue and cash flow for the company? Then our free report on Palinda Group Holdings will help you shine a light on its historical performance.What Are Revenue Growth Metrics Telling Us About The P/S?
Palinda Group Holdings' P/S ratio would be typical for a company that's only expected to deliver moderate growth, and importantly, perform in line with the industry.
In reviewing the last year of financials, we were disheartened to see the company's revenues fell to the tune of 21%. However, a few very strong years before that means that it was still able to grow revenue by an impressive 108% in total over the last three years. Although it's been a bumpy ride, it's still fair to say the revenue growth recently has been more than adequate for the company.
Weighing that recent medium-term revenue trajectory against the broader industry's one-year forecast for expansion of 29% shows it's about the same on an annualised basis.
With this in consideration, it's clear to see why Palinda Group Holdings' P/S matches up closely to its industry peers. It seems most investors are expecting to see average growth rates continue into the future and are only willing to pay a moderate amount for the stock.
What We Can Learn From Palinda Group Holdings' P/S?
We'd say the price-to-sales ratio's power isn't primarily as a valuation instrument but rather to gauge current investor sentiment and future expectations.
As we've seen, Palinda Group Holdings' three-year revenue trends seem to be contributing to its P/S, given they look similar to current industry expectations. Currently, with a past revenue trend that aligns closely wit the industry outlook, shareholders are confident the company's future revenue outlook won't contain any major surprises. Unless the recent medium-term conditions change, they will continue to support the share price at these levels.
We don't want to rain on the parade too much, but we did also find 4 warning signs for Palinda Group Holdings (1 is concerning!) that you need to be mindful of.
If companies with solid past earnings growth is up your alley, you may wish to see this free collection of other companies with strong earnings growth and low P/E ratios.
New: Manage All Your Stock Portfolios in One Place
We've created the ultimate portfolio companion for stock investors, and it's free.
• Connect an unlimited number of Portfolios and see your total in one currency
• Be alerted to new Warning Signs or Risks via email or mobile
• Track the Fair Value of your stocks
Have feedback on this article? Concerned about the content? Get in touch with us directly. Alternatively, email editorial-team (at) simplywallst.com.
This article by Simply Wall St is general in nature. We provide commentary based on historical data and analyst forecasts only using an unbiased methodology and our articles are not intended to be financial advice. It does not constitute a recommendation to buy or sell any stock, and does not take account of your objectives, or your financial situation. We aim to bring you long-term focused analysis driven by fundamental data. Note that our analysis may not factor in the latest price-sensitive company announcements or qualitative material. Simply Wall St has no position in any stocks mentioned.
About SEHK:8179
Palinda Group Holdings
An investment holding company, engages in the sales and distribution of wine products and ancillary wines-related products in Hong Kong and Australia.
Slight with mediocre balance sheet.
Market Insights

Advertisement
Community Narratives
The Most Undervalued of the Magnificent 7
Fair Value US$237.43|36.3% undervalued
IN
Community Contributor
PVA TePla's New Strategy Aims for 22% Revenue Growth in Semiconductor Recovery
Fair Value €19.19|20.8% undervalued
MI
Community Contributor