- Hong Kong
- /
- Retail Distributors
- /
- SEHK:39
These 4 Measures Indicate That China Beidahuang Industry Group Holdings (HKG:39) Is Using Debt Extensively


The external fund manager backed by Berkshire Hathaway's Charlie Munger, Li Lu, makes no bones about it when he says 'The biggest investment risk is not the volatility of prices, but whether you will suffer a permanent loss of capital.' When we think about how risky a company is, we always like to look at its use of debt, since debt overload can lead to ruin. We can see that China Beidahuang Industry Group Holdings Limited (HKG:39) does use debt in its business. But the more important question is: how much risk is that debt creating?
Why Does Debt Bring Risk?
Generally speaking, debt only becomes a real problem when a company can't easily pay it off, either by raising capital or with its own cash flow. Ultimately, if the company can't fulfill its legal obligations to repay debt, shareholders could walk away with nothing. While that is not too common, we often do see indebted companies permanently diluting shareholders because lenders force them to raise capital at a distressed price. Having said that, the most common situation is where a company manages its debt reasonably well - and to its own advantage. The first thing to do when considering how much debt a business uses is to look at its cash and debt together.
Our analysis indicates that 39 is potentially undervalued!
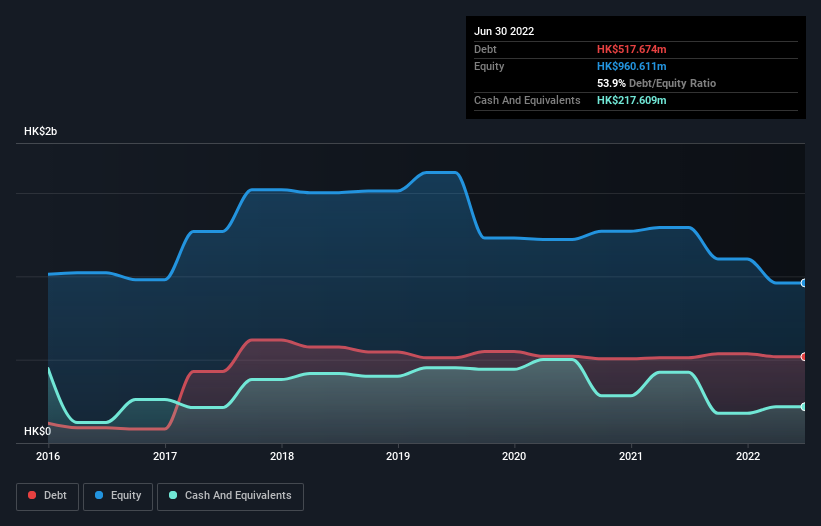
How Much Debt Does China Beidahuang Industry Group Holdings Carry?
The chart below, which you can click on for greater detail, shows that China Beidahuang Industry Group Holdings had HK$517.7m in debt in June 2022; about the same as the year before. However, it also had HK$217.6m in cash, and so its net debt is HK$300.1m.
How Healthy Is China Beidahuang Industry Group Holdings' Balance Sheet?
According to the last reported balance sheet, China Beidahuang Industry Group Holdings had liabilities of HK$1.19b due within 12 months, and liabilities of HK$487.8m due beyond 12 months. Offsetting this, it had HK$217.6m in cash and HK$326.6m in receivables that were due within 12 months. So its liabilities total HK$1.13b more than the combination of its cash and short-term receivables.
The deficiency here weighs heavily on the HK$618.7m company itself, as if a child were struggling under the weight of an enormous back-pack full of books, his sports gear, and a trumpet. So we definitely think shareholders need to watch this one closely. After all, China Beidahuang Industry Group Holdings would likely require a major re-capitalisation if it had to pay its creditors today.
We use two main ratios to inform us about debt levels relative to earnings. The first is net debt divided by earnings before interest, tax, depreciation, and amortization (EBITDA), while the second is how many times its earnings before interest and tax (EBIT) covers its interest expense (or its interest cover, for short). The advantage of this approach is that we take into account both the absolute quantum of debt (with net debt to EBITDA) and the actual interest expenses associated with that debt (with its interest cover ratio).
Weak interest cover of 0.13 times and a disturbingly high net debt to EBITDA ratio of 10.9 hit our confidence in China Beidahuang Industry Group Holdings like a one-two punch to the gut. This means we'd consider it to have a heavy debt load. Even worse, China Beidahuang Industry Group Holdings saw its EBIT tank 57% over the last 12 months. If earnings keep going like that over the long term, it has a snowball's chance in hell of paying off that debt. The balance sheet is clearly the area to focus on when you are analysing debt. But it is China Beidahuang Industry Group Holdings's earnings that will influence how the balance sheet holds up in the future. So when considering debt, it's definitely worth looking at the earnings trend. Click here for an interactive snapshot.
Finally, a company can only pay off debt with cold hard cash, not accounting profits. So we always check how much of that EBIT is translated into free cash flow. Over the last two years, China Beidahuang Industry Group Holdings actually produced more free cash flow than EBIT. That sort of strong cash generation warms our hearts like a puppy in a bumblebee suit.
Our View
To be frank both China Beidahuang Industry Group Holdings's EBIT growth rate and its track record of staying on top of its total liabilities make us rather uncomfortable with its debt levels. But on the bright side, its conversion of EBIT to free cash flow is a good sign, and makes us more optimistic. After considering the datapoints discussed, we think China Beidahuang Industry Group Holdings has too much debt. That sort of riskiness is ok for some, but it certainly doesn't float our boat. There's no doubt that we learn most about debt from the balance sheet. But ultimately, every company can contain risks that exist outside of the balance sheet. Case in point: We've spotted 2 warning signs for China Beidahuang Industry Group Holdings you should be aware of, and 1 of them is concerning.
If, after all that, you're more interested in a fast growing company with a rock-solid balance sheet, then check out our list of net cash growth stocks without delay.
If you're looking to trade China Beidahuang Industry Group Holdings, open an account with the lowest-cost platform trusted by professionals, Interactive Brokers.
With clients in over 200 countries and territories, and access to 160 markets, IBKR lets you trade stocks, options, futures, forex, bonds and funds from a single integrated account.
Enjoy no hidden fees, no account minimums, and FX conversion rates as low as 0.03%, far better than what most brokers offer.
Sponsored ContentNew: AI Stock Screener & Alerts
Our new AI Stock Screener scans the market every day to uncover opportunities.
• Dividend Powerhouses (3%+ Yield)
• Undervalued Small Caps with Insider Buying
• High growth Tech and AI Companies
Or build your own from over 50 metrics.
Have feedback on this article? Concerned about the content? Get in touch with us directly. Alternatively, email editorial-team (at) simplywallst.com.
This article by Simply Wall St is general in nature. We provide commentary based on historical data and analyst forecasts only using an unbiased methodology and our articles are not intended to be financial advice. It does not constitute a recommendation to buy or sell any stock, and does not take account of your objectives, or your financial situation. We aim to bring you long-term focused analysis driven by fundamental data. Note that our analysis may not factor in the latest price-sensitive company announcements or qualitative material. Simply Wall St has no position in any stocks mentioned.
About SEHK:39
China Beidahuang Industry Group Holdings
An investment holding company, engages in the wine and liquor, food products trading, construction and development, rental, financial leasing, and mineral products businesses in the People’s Republic of China and Hong Kong.
Mediocre balance sheet very low.
Market Insights

Community Narratives

