- Hong Kong
- /
- Retail Distributors
- /
- SEHK:39
China Beidahuang Industry Group Holdings (HKG:39) Will Be Hoping To Turn Its Returns On Capital Around


Ignoring the stock price of a company, what are the underlying trends that tell us a business is past the growth phase? A business that's potentially in decline often shows two trends, a return on capital employed (ROCE) that's declining, and a base of capital employed that's also declining. Basically the company is earning less on its investments and it is also reducing its total assets. And from a first read, things don't look too good at China Beidahuang Industry Group Holdings (HKG:39), so let's see why.
Understanding Return On Capital Employed (ROCE)
For those who don't know, ROCE is a measure of a company's yearly pre-tax profit (its return), relative to the capital employed in the business. To calculate this metric for China Beidahuang Industry Group Holdings, this is the formula:
Return on Capital Employed = Earnings Before Interest and Tax (EBIT) ÷ (Total Assets - Current Liabilities)
0.032 = HK$25m ÷ (HK$1.9b - HK$1.1b) (Based on the trailing twelve months to June 2023).
Therefore, China Beidahuang Industry Group Holdings has an ROCE of 3.2%. In absolute terms, that's a low return but it's around the Retail Distributors industry average of 4.0%.
View our latest analysis for China Beidahuang Industry Group Holdings
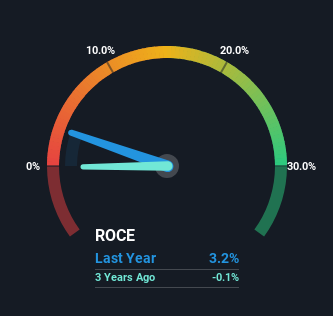
Historical performance is a great place to start when researching a stock so above you can see the gauge for China Beidahuang Industry Group Holdings' ROCE against it's prior returns. If you're interested in investigating China Beidahuang Industry Group Holdings' past further, check out this free graph of past earnings, revenue and cash flow.
What Does the ROCE Trend For China Beidahuang Industry Group Holdings Tell Us?
The trend of returns that China Beidahuang Industry Group Holdings is generating are raising some concerns. To be more specific, today's ROCE was 9.0% five years ago but has since fallen to 3.2%. In addition to that, China Beidahuang Industry Group Holdings is now employing 54% less capital than it was five years ago. When you see both ROCE and capital employed diminishing, it can often be a sign of a mature and shrinking business that might be in structural decline. Typically businesses that exhibit these characteristics aren't the ones that tend to multiply over the long term, because statistically speaking, they've already gone through the growth phase of their life cycle.
On a side note, China Beidahuang Industry Group Holdings' current liabilities have increased over the last five years to 58% of total assets, effectively distorting the ROCE to some degree. If current liabilities hadn't increased as much as they did, the ROCE could actually be even lower. What this means is that in reality, a rather large portion of the business is being funded by the likes of the company's suppliers or short-term creditors, which can bring some risks of its own.
In Conclusion...
In summary, it's unfortunate that China Beidahuang Industry Group Holdings is shrinking its capital base and also generating lower returns. We expect this has contributed to the stock plummeting 71% during the last five years. Unless there is a shift to a more positive trajectory in these metrics, we would look elsewhere.
If you want to know some of the risks facing China Beidahuang Industry Group Holdings we've found 3 warning signs (2 can't be ignored!) that you should be aware of before investing here.
If you want to search for solid companies with great earnings, check out this free list of companies with good balance sheets and impressive returns on equity.
New: AI Stock Screener & Alerts
Our new AI Stock Screener scans the market every day to uncover opportunities.
• Dividend Powerhouses (3%+ Yield)
• Undervalued Small Caps with Insider Buying
• High growth Tech and AI Companies
Or build your own from over 50 metrics.
Have feedback on this article? Concerned about the content? Get in touch with us directly. Alternatively, email editorial-team (at) simplywallst.com.
This article by Simply Wall St is general in nature. We provide commentary based on historical data and analyst forecasts only using an unbiased methodology and our articles are not intended to be financial advice. It does not constitute a recommendation to buy or sell any stock, and does not take account of your objectives, or your financial situation. We aim to bring you long-term focused analysis driven by fundamental data. Note that our analysis may not factor in the latest price-sensitive company announcements or qualitative material. Simply Wall St has no position in any stocks mentioned.
About SEHK:39
China Beidahuang Industry Group Holdings
An investment holding company, engages in the wine and liquor, food products trading, construction and development, rental, financial leasing, and mineral products businesses in the People’s Republic of China and Hong Kong.
Mediocre balance sheet very low.
Market Insights

Community Narratives

