- Hong Kong
- /
- Specialty Stores
- /
- SEHK:3813
Pou Sheng International (Holdings) Limited's (HKG:3813) Business Is Trailing The Industry But Its Shares Aren't

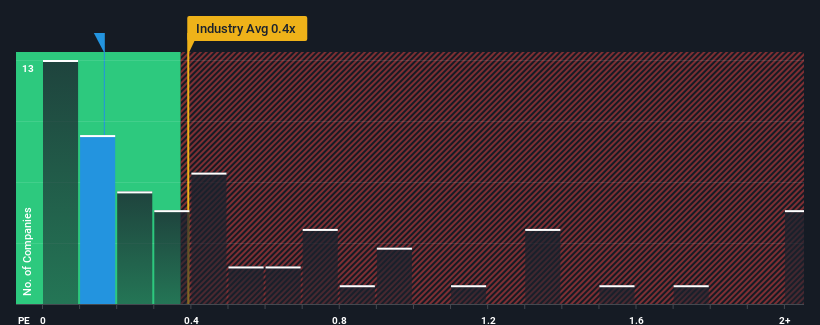
It's not a stretch to say that Pou Sheng International (Holdings) Limited's (HKG:3813) price-to-sales (or "P/S") ratio of 0.2x right now seems quite "middle-of-the-road" for companies in the Specialty Retail industry in Hong Kong, where the median P/S ratio is around 0.4x. While this might not raise any eyebrows, if the P/S ratio is not justified investors could be missing out on a potential opportunity or ignoring looming disappointment.
View our latest analysis for Pou Sheng International (Holdings)
How Has Pou Sheng International (Holdings) Performed Recently?
Pou Sheng International (Holdings) could be doing better as its revenue has been going backwards lately while most other companies have been seeing positive revenue growth. It might be that many expect the dour revenue performance to strengthen positively, which has kept the P/S from falling. However, if this isn't the case, investors might get caught out paying too much for the stock.
Keen to find out how analysts think Pou Sheng International (Holdings)'s future stacks up against the industry? In that case, our free report is a great place to start.Is There Some Revenue Growth Forecasted For Pou Sheng International (Holdings)?
There's an inherent assumption that a company should be matching the industry for P/S ratios like Pou Sheng International (Holdings)'s to be considered reasonable.
Taking a look back first, we see that there was hardly any revenue growth to speak of for the company over the past year. This isn't what shareholders were looking for as it means they've been left with a 23% decline in revenue over the last three years in total. So unfortunately, we have to acknowledge that the company has not done a great job of growing revenue over that time.
Turning to the outlook, the next year should generate growth of 13% as estimated by the eight analysts watching the company. Meanwhile, the rest of the industry is forecast to expand by 16%, which is noticeably more attractive.
With this information, we find it interesting that Pou Sheng International (Holdings) is trading at a fairly similar P/S compared to the industry. Apparently many investors in the company are less bearish than analysts indicate and aren't willing to let go of their stock right now. These shareholders may be setting themselves up for future disappointment if the P/S falls to levels more in line with the growth outlook.
What We Can Learn From Pou Sheng International (Holdings)'s P/S?
It's argued the price-to-sales ratio is an inferior measure of value within certain industries, but it can be a powerful business sentiment indicator.
Given that Pou Sheng International (Holdings)'s revenue growth projections are relatively subdued in comparison to the wider industry, it comes as a surprise to see it trading at its current P/S ratio. When we see companies with a relatively weaker revenue outlook compared to the industry, we suspect the share price is at risk of declining, sending the moderate P/S lower. This places shareholders' investments at risk and potential investors in danger of paying an unnecessary premium.
You should always think about risks. Case in point, we've spotted 1 warning sign for Pou Sheng International (Holdings) you should be aware of.
If these risks are making you reconsider your opinion on Pou Sheng International (Holdings), explore our interactive list of high quality stocks to get an idea of what else is out there.
New: Manage All Your Stock Portfolios in One Place
We've created the ultimate portfolio companion for stock investors, and it's free.
• Connect an unlimited number of Portfolios and see your total in one currency
• Be alerted to new Warning Signs or Risks via email or mobile
• Track the Fair Value of your stocks
Have feedback on this article? Concerned about the content? Get in touch with us directly. Alternatively, email editorial-team (at) simplywallst.com.
This article by Simply Wall St is general in nature. We provide commentary based on historical data and analyst forecasts only using an unbiased methodology and our articles are not intended to be financial advice. It does not constitute a recommendation to buy or sell any stock, and does not take account of your objectives, or your financial situation. We aim to bring you long-term focused analysis driven by fundamental data. Note that our analysis may not factor in the latest price-sensitive company announcements or qualitative material. Simply Wall St has no position in any stocks mentioned.
About SEHK:3813
Pou Sheng International (Holdings)
An investment holding company, engages in distributing and retailing sportswear and footwear in the People’s Republic of China and internationally.
Flawless balance sheet and undervalued.
Similar Companies
Market Insights

Community Narratives
