
Advertisement
- Hong Kong
- /
- Specialty Stores
- /
- SEHK:2101
Fulu Holdings (HKG:2101) Will Want To Turn Around Its Return Trends

If you're looking for a multi-bagger, there's a few things to keep an eye out for. Ideally, a business will show two trends; firstly a growing return on capital employed (ROCE) and secondly, an increasing amount of capital employed. This shows us that it's a compounding machine, able to continually reinvest its earnings back into the business and generate higher returns. However, after investigating Fulu Holdings (HKG:2101), we don't think it's current trends fit the mold of a multi-bagger.
Return On Capital Employed (ROCE): What Is It?
For those who don't know, ROCE is a measure of a company's yearly pre-tax profit (its return), relative to the capital employed in the business. The formula for this calculation on Fulu Holdings is:
Return on Capital Employed = Earnings Before Interest and Tax (EBIT) ÷ (Total Assets - Current Liabilities)
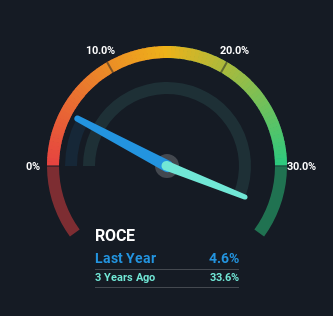
0.046 = CN¥57m ÷ (CN¥1.7b - CN¥500m) (Based on the trailing twelve months to June 2023).
Thus, Fulu Holdings has an ROCE of 4.6%. Ultimately, that's a low return and it under-performs the Specialty Retail industry average of 9.0%.
See our latest analysis for Fulu Holdings
While the past is not representative of the future, it can be helpful to know how a company has performed historically, which is why we have this chart above. If you want to delve into the historical earnings, revenue and cash flow of Fulu Holdings, check out these free graphs here.
So How Is Fulu Holdings' ROCE Trending?
When we looked at the ROCE trend at Fulu Holdings, we didn't gain much confidence. Over the last five years, returns on capital have decreased to 4.6% from 55% five years ago. However, given capital employed and revenue have both increased it appears that the business is currently pursuing growth, at the consequence of short term returns. If these investments prove successful, this can bode very well for long term stock performance.
On a related note, Fulu Holdings has decreased its current liabilities to 29% of total assets. That could partly explain why the ROCE has dropped. What's more, this can reduce some aspects of risk to the business because now the company's suppliers or short-term creditors are funding less of its operations. Some would claim this reduces the business' efficiency at generating ROCE since it is now funding more of the operations with its own money.
Our Take On Fulu Holdings' ROCE
In summary, despite lower returns in the short term, we're encouraged to see that Fulu Holdings is reinvesting for growth and has higher sales as a result. These growth trends haven't led to growth returns though, since the stock has fallen 58% over the last three years. As a result, we'd recommend researching this stock further to uncover what other fundamentals of the business can show us.
Fulu Holdings does have some risks, we noticed 4 warning signs (and 2 which don't sit too well with us) we think you should know about.
For those who like to invest in solid companies, check out this free list of companies with solid balance sheets and high returns on equity.
New: AI Stock Screener & Alerts
Our new AI Stock Screener scans the market every day to uncover opportunities.
• Dividend Powerhouses (3%+ Yield)
• Undervalued Small Caps with Insider Buying
• High growth Tech and AI Companies
Or build your own from over 50 metrics.
Have feedback on this article? Concerned about the content? Get in touch with us directly. Alternatively, email editorial-team (at) simplywallst.com.
This article by Simply Wall St is general in nature. We provide commentary based on historical data and analyst forecasts only using an unbiased methodology and our articles are not intended to be financial advice. It does not constitute a recommendation to buy or sell any stock, and does not take account of your objectives, or your financial situation. We aim to bring you long-term focused analysis driven by fundamental data. Note that our analysis may not factor in the latest price-sensitive company announcements or qualitative material. Simply Wall St has no position in any stocks mentioned.
About SEHK:2101
Fulu Holdings
Operates a third-party digital goods and services platform in China.
Flawless balance sheet low.
Similar Companies
Market Insights


Advertisement
Community Narratives
Suncorp’s Next Chapter: Insurance-Only and Ready to Grow
Fair Value AU$22.83|4.9% undervalued
RO
Community Contributor
Thyssenkrupp Nucera Will Achieve Double-Digit Profits by 2030 Boosted by Hydrogen Growth
Fair Value €14.40|32.5% undervalued
CH
Community Contributor
Tesla’s Nvidia Moment – The AI & Robotics Inflection Point
Fair Value US$384.84|21.9% undervalued
BL
Community Contributor