
Advertisement
- Hong Kong
- /
- Retail Distributors
- /
- SEHK:186
Market Cool On Nimble Holdings Company Limited's (HKG:186) Revenues Pushing Shares 34% Lower
Nimble Holdings Company Limited (HKG:186) shareholders won't be pleased to see that the share price has had a very rough month, dropping 34% and undoing the prior period's positive performance. The drop over the last 30 days has capped off a tough year for shareholders, with the share price down 28% in that time.
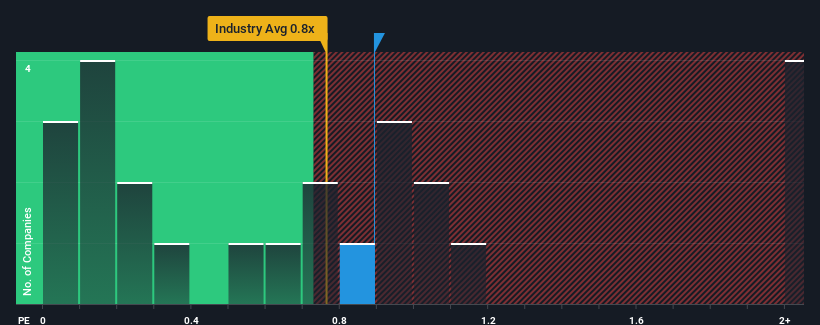
Although its price has dipped substantially, you could still be forgiven for feeling indifferent about Nimble Holdings' P/S ratio of 0.9x, since the median price-to-sales (or "P/S") ratio for the Retail Distributors industry in Hong Kong is also close to 0.8x. However, investors might be overlooking a clear opportunity or potential setback if there is no rational basis for the P/S.
View our latest analysis for Nimble Holdings
How Has Nimble Holdings Performed Recently?
Recent times have been quite advantageous for Nimble Holdings as its revenue has been rising very briskly. It might be that many expect the strong revenue performance to wane, which has kept the share price, and thus the P/S ratio, from rising. Those who are bullish on Nimble Holdings will be hoping that this isn't the case, so that they can pick up the stock at a lower valuation.
We don't have analyst forecasts, but you can see how recent trends are setting up the company for the future by checking out our free report on Nimble Holdings' earnings, revenue and cash flow.Do Revenue Forecasts Match The P/S Ratio?
The only time you'd be comfortable seeing a P/S like Nimble Holdings' is when the company's growth is tracking the industry closely.
Taking a look back first, we see that the company grew revenue by an impressive 169% last year. The latest three year period has also seen an incredible overall rise in revenue, aided by its incredible short-term performance. So we can start by confirming that the company has done a tremendous job of growing revenue over that time.
This is in contrast to the rest of the industry, which is expected to grow by 23% over the next year, materially lower than the company's recent medium-term annualised growth rates.
In light of this, it's curious that Nimble Holdings' P/S sits in line with the majority of other companies. Apparently some shareholders believe the recent performance is at its limits and have been accepting lower selling prices.
What Does Nimble Holdings' P/S Mean For Investors?
With its share price dropping off a cliff, the P/S for Nimble Holdings looks to be in line with the rest of the Retail Distributors industry. It's argued the price-to-sales ratio is an inferior measure of value within certain industries, but it can be a powerful business sentiment indicator.
To our surprise, Nimble Holdings revealed its three-year revenue trends aren't contributing to its P/S as much as we would have predicted, given they look better than current industry expectations. When we see strong revenue with faster-than-industry growth, we can only assume potential risks are what might be placing pressure on the P/S ratio. At least the risk of a price drop looks to be subdued if recent medium-term revenue trends continue, but investors seem to think future revenue could see some volatility.
Before you take the next step, you should know about the 4 warning signs for Nimble Holdings (1 is a bit unpleasant!) that we have uncovered.
Of course, profitable companies with a history of great earnings growth are generally safer bets. So you may wish to see this free collection of other companies that have reasonable P/E ratios and have grown earnings strongly.
Valuation is complex, but we're here to simplify it.
Discover if Nimble Holdings might be undervalued or overvalued with our detailed analysis, featuring fair value estimates, potential risks, dividends, insider trades, and its financial condition.
Access Free AnalysisHave feedback on this article? Concerned about the content? Get in touch with us directly. Alternatively, email editorial-team (at) simplywallst.com.
This article by Simply Wall St is general in nature. We provide commentary based on historical data and analyst forecasts only using an unbiased methodology and our articles are not intended to be financial advice. It does not constitute a recommendation to buy or sell any stock, and does not take account of your objectives, or your financial situation. We aim to bring you long-term focused analysis driven by fundamental data. Note that our analysis may not factor in the latest price-sensitive company announcements or qualitative material. Simply Wall St has no position in any stocks mentioned.
About SEHK:186
Nimble Holdings
An investment holding company, engages in property development and operation in the People’s Republic of China and the United States.
Adequate balance sheet and slightly overvalued.
Market Insights

Advertisement
Community Narratives
MINISO's fair value is projected at 26.69 with an anticipated PE ratio shift of 20x
Fair Value US$24.03|11.0% undervalued
BE
Community Contributor
Procter & Gamble: A Dividend Giant Facing Slowing Growth
Fair Value US$119.81|23.3% overvalued
AN
Community Contributor
Eli Lilly's Future Growth Driven by Tirzepatide and Favorable Market Conditions
Fair Value US$1.19k|13.8% undervalued
EA
Community Contributor