
Advertisement
- Hong Kong
- /
- Real Estate
- /
- SEHK:2329
Guorui Properties (HKG:2329) investors are sitting on a loss of 84% if they invested five years ago
Some stocks are best avoided. We don't wish catastrophic capital loss on anyone. For example, we sympathize with anyone who was caught holding Guorui Properties Limited (HKG:2329) during the five years that saw its share price drop a whopping 87%. And some of the more recent buyers are probably worried, too, with the stock falling 59% in the last year. On the other hand the share price has bounced 10.0% over the last week. We really hope anyone holding through that price crash has a diversified portfolio. Even when you lose money, you don't have to lose the lesson.
Since shareholders are down over the longer term, lets look at the underlying fundamentals over the that time and see if they've been consistent with returns.
Check out our latest analysis for Guorui Properties
While the efficient markets hypothesis continues to be taught by some, it has been proven that markets are over-reactive dynamic systems, and investors are not always rational. One way to examine how market sentiment has changed over time is to look at the interaction between a company's share price and its earnings per share (EPS).
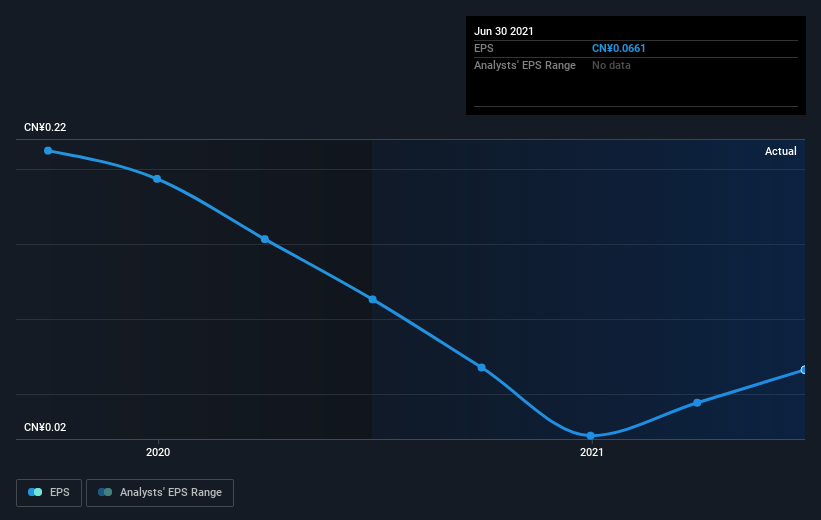
During the five years over which the share price declined, Guorui Properties' earnings per share (EPS) dropped by 26% each year. This reduction in EPS is less than the 33% annual reduction in the share price. This implies that the market was previously too optimistic about the stock. The low P/E ratio of 4.06 further reflects this reticence.
The graphic below depicts how EPS has changed over time (unveil the exact values by clicking on the image).
We consider it positive that insiders have made significant purchases in the last year. Even so, future earnings will be far more important to whether current shareholders make money. Before buying or selling a stock, we always recommend a close examination of historic growth trends, available here..
What about the Total Shareholder Return (TSR)?
Investors should note that there's a difference between Guorui Properties' total shareholder return (TSR) and its share price change, which we've covered above. The TSR attempts to capture the value of dividends (as if they were reinvested) as well as any spin-offs or discounted capital raisings offered to shareholders. Its history of dividend payouts mean that Guorui Properties' TSR, which was a 84% drop over the last 5 years, was not as bad as the share price return.
A Different Perspective
We regret to report that Guorui Properties shareholders are down 59% for the year. Unfortunately, that's worse than the broader market decline of 14%. However, it could simply be that the share price has been impacted by broader market jitters. It might be worth keeping an eye on the fundamentals, in case there's a good opportunity. Unfortunately, last year's performance may indicate unresolved challenges, given that it was worse than the annualised loss of 13% over the last half decade. We realise that Baron Rothschild has said investors should "buy when there is blood on the streets", but we caution that investors should first be sure they are buying a high quality business. It's always interesting to track share price performance over the longer term. But to understand Guorui Properties better, we need to consider many other factors. For example, we've discovered 4 warning signs for Guorui Properties (2 don't sit too well with us!) that you should be aware of before investing here.
There are plenty of other companies that have insiders buying up shares. You probably do not want to miss this free list of growing companies that insiders are buying.
Please note, the market returns quoted in this article reflect the market weighted average returns of stocks that currently trade on HK exchanges.
New: Manage All Your Stock Portfolios in One Place
We've created the ultimate portfolio companion for stock investors, and it's free.
• Connect an unlimited number of Portfolios and see your total in one currency
• Be alerted to new Warning Signs or Risks via email or mobile
• Track the Fair Value of your stocks
Have feedback on this article? Concerned about the content? Get in touch with us directly. Alternatively, email editorial-team (at) simplywallst.com.
This article by Simply Wall St is general in nature. We provide commentary based on historical data and analyst forecasts only using an unbiased methodology and our articles are not intended to be financial advice. It does not constitute a recommendation to buy or sell any stock, and does not take account of your objectives, or your financial situation. We aim to bring you long-term focused analysis driven by fundamental data. Note that our analysis may not factor in the latest price-sensitive company announcements or qualitative material. Simply Wall St has no position in any stocks mentioned.
About SEHK:2329
Glory Health Industry
An investment holding company, engages in the property development business in the People’s Republic of China.
Good value with low risk.
Market Insights

Advertisement
Community Narratives
MINISO's fair value is projected at 26.69 with an anticipated PE ratio shift of 20x
Fair Value US$24.03|11.0% undervalued
BE
Community Contributor
Procter & Gamble: A Dividend Giant Facing Slowing Growth
Fair Value US$119.81|23.3% overvalued
AN
Community Contributor
Eli Lilly's Future Growth Driven by Tirzepatide and Favorable Market Conditions
Fair Value US$1.19k|13.8% undervalued
EA
Community Contributor