- Hong Kong
- /
- Real Estate
- /
- SEHK:606
SCE Intelligent Commercial Management Holdings Limited (HKG:606) Stock Catapults 36% Though Its Price And Business Still Lag The Market


SCE Intelligent Commercial Management Holdings Limited (HKG:606) shares have had a really impressive month, gaining 36% after a shaky period beforehand. Still, the 30-day jump doesn't change the fact that longer term shareholders have seen their stock decimated by the 72% share price drop in the last twelve months.
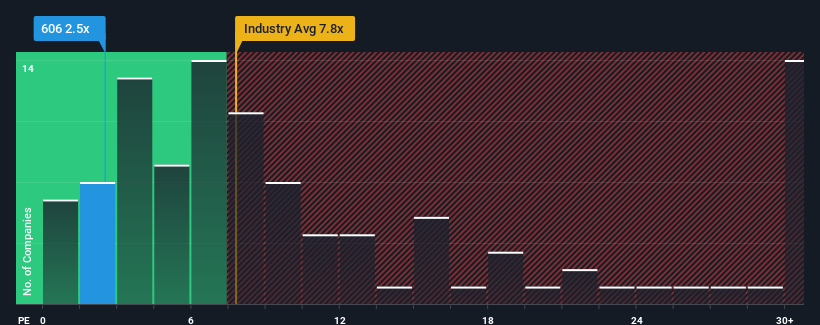
Even after such a large jump in price, given about half the companies in Hong Kong have price-to-earnings ratios (or "P/E's") above 10x, you may still consider SCE Intelligent Commercial Management Holdings as a highly attractive investment with its 2.5x P/E ratio. Although, it's not wise to just take the P/E at face value as there may be an explanation why it's so limited.
For example, consider that SCE Intelligent Commercial Management Holdings' financial performance has been poor lately as its earnings have been in decline. It might be that many expect the disappointing earnings performance to continue or accelerate, which has repressed the P/E. However, if this doesn't eventuate then existing shareholders may be feeling optimistic about the future direction of the share price.
Check out our latest analysis for SCE Intelligent Commercial Management Holdings
How Is SCE Intelligent Commercial Management Holdings' Growth Trending?
In order to justify its P/E ratio, SCE Intelligent Commercial Management Holdings would need to produce anemic growth that's substantially trailing the market.
Taking a look back first, the company's earnings per share growth last year wasn't something to get excited about as it posted a disappointing decline of 1.3%. This means it has also seen a slide in earnings over the longer-term as EPS is down 32% in total over the last three years. Therefore, it's fair to say the earnings growth recently has been undesirable for the company.
Comparing that to the market, which is predicted to deliver 22% growth in the next 12 months, the company's downward momentum based on recent medium-term earnings results is a sobering picture.
With this information, we are not surprised that SCE Intelligent Commercial Management Holdings is trading at a P/E lower than the market. However, we think shrinking earnings are unlikely to lead to a stable P/E over the longer term, which could set up shareholders for future disappointment. Even just maintaining these prices could be difficult to achieve as recent earnings trends are already weighing down the shares.
The Key Takeaway
SCE Intelligent Commercial Management Holdings' recent share price jump still sees its P/E sitting firmly flat on the ground. Using the price-to-earnings ratio alone to determine if you should sell your stock isn't sensible, however it can be a practical guide to the company's future prospects.
We've established that SCE Intelligent Commercial Management Holdings maintains its low P/E on the weakness of its sliding earnings over the medium-term, as expected. At this stage investors feel the potential for an improvement in earnings isn't great enough to justify a higher P/E ratio. If recent medium-term earnings trends continue, it's hard to see the share price moving strongly in either direction in the near future under these circumstances.
Before you settle on your opinion, we've discovered 1 warning sign for SCE Intelligent Commercial Management Holdings that you should be aware of.
If P/E ratios interest you, you may wish to see this free collection of other companies with strong earnings growth and low P/E ratios.
New: Manage All Your Stock Portfolios in One Place
We've created the ultimate portfolio companion for stock investors, and it's free.
• Connect an unlimited number of Portfolios and see your total in one currency
• Be alerted to new Warning Signs or Risks via email or mobile
• Track the Fair Value of your stocks
Have feedback on this article? Concerned about the content? Get in touch with us directly. Alternatively, email editorial-team (at) simplywallst.com.
This article by Simply Wall St is general in nature. We provide commentary based on historical data and analyst forecasts only using an unbiased methodology and our articles are not intended to be financial advice. It does not constitute a recommendation to buy or sell any stock, and does not take account of your objectives, or your financial situation. We aim to bring you long-term focused analysis driven by fundamental data. Note that our analysis may not factor in the latest price-sensitive company announcements or qualitative material. Simply Wall St has no position in any stocks mentioned.
About SEHK:606
SCE Intelligent Commercial Management Holdings
Provides property management services for commercial and residential properties in the People’s Republic of China.
Flawless balance sheet and good value.
Market Insights

Community Narratives
