
Advertisement
- Hong Kong
- /
- Real Estate
- /
- SEHK:535
Why We're Not Concerned Yet About Gemdale Properties and Investment Corporation Limited's (HKG:535) 26% Share Price Plunge
Unfortunately for some shareholders, the Gemdale Properties and Investment Corporation Limited (HKG:535) share price has dived 26% in the last thirty days, prolonging recent pain. The recent drop completes a disastrous twelve months for shareholders, who are sitting on a 61% loss during that time.
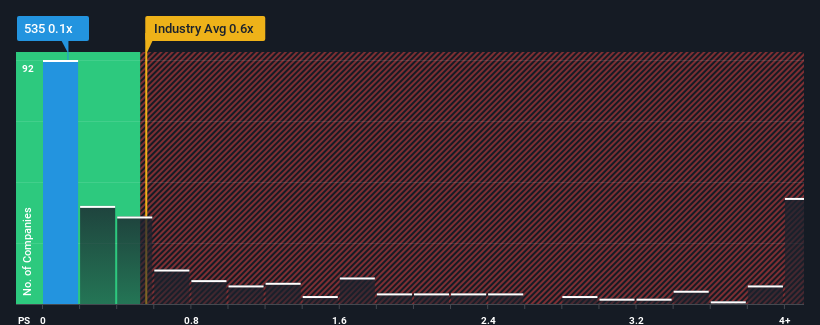
Even after such a large drop in price, it's still not a stretch to say that Gemdale Properties and Investment's price-to-sales (or "P/S") ratio of 0.1x right now seems quite "middle-of-the-road" compared to the Real Estate industry in Hong Kong, where the median P/S ratio is around 0.6x. While this might not raise any eyebrows, if the P/S ratio is not justified investors could be missing out on a potential opportunity or ignoring looming disappointment.
See our latest analysis for Gemdale Properties and Investment
How Has Gemdale Properties and Investment Performed Recently?
With revenue growth that's exceedingly strong of late, Gemdale Properties and Investment has been doing very well. The P/S is probably moderate because investors think this strong revenue growth might not be enough to outperform the broader industry in the near future. Those who are bullish on Gemdale Properties and Investment will be hoping that this isn't the case, so that they can pick up the stock at a lower valuation.
We don't have analyst forecasts, but you can see how recent trends are setting up the company for the future by checking out our free report on Gemdale Properties and Investment's earnings, revenue and cash flow.How Is Gemdale Properties and Investment's Revenue Growth Trending?
The only time you'd be comfortable seeing a P/S like Gemdale Properties and Investment's is when the company's growth is tracking the industry closely.
If we review the last year of revenue growth, the company posted a terrific increase of 76%. The latest three year period has also seen a 15% overall rise in revenue, aided extensively by its short-term performance. Accordingly, shareholders would have probably been satisfied with the medium-term rates of revenue growth.
Comparing that to the industry, which is predicted to deliver 5.2% growth in the next 12 months, the company's momentum is pretty similar based on recent medium-term annualised revenue results.
With this in consideration, it's clear to see why Gemdale Properties and Investment's P/S matches up closely to its industry peers. It seems most investors are expecting to see average growth rates continue into the future and are only willing to pay a moderate amount for the stock.
The Bottom Line On Gemdale Properties and Investment's P/S
With its share price dropping off a cliff, the P/S for Gemdale Properties and Investment looks to be in line with the rest of the Real Estate industry. Using the price-to-sales ratio alone to determine if you should sell your stock isn't sensible, however it can be a practical guide to the company's future prospects.
It appears to us that Gemdale Properties and Investment maintains its moderate P/S off the back of its recent three-year growth being in line with the wider industry forecast. Currently, with a past revenue trend that aligns closely wit the industry outlook, shareholders are confident the company's future revenue outlook won't contain any major surprises. Given the current circumstances, it seems improbable that the share price will experience any significant movement in either direction in the near future if recent medium-term revenue trends persist.
Before you take the next step, you should know about the 2 warning signs for Gemdale Properties and Investment that we have uncovered.
If companies with solid past earnings growth is up your alley, you may wish to see this free collection of other companies with strong earnings growth and low P/E ratios.
New: Manage All Your Stock Portfolios in One Place
We've created the ultimate portfolio companion for stock investors, and it's free.
• Connect an unlimited number of Portfolios and see your total in one currency
• Be alerted to new Warning Signs or Risks via email or mobile
• Track the Fair Value of your stocks
Have feedback on this article? Concerned about the content? Get in touch with us directly. Alternatively, email editorial-team (at) simplywallst.com.
This article by Simply Wall St is general in nature. We provide commentary based on historical data and analyst forecasts only using an unbiased methodology and our articles are not intended to be financial advice. It does not constitute a recommendation to buy or sell any stock, and does not take account of your objectives, or your financial situation. We aim to bring you long-term focused analysis driven by fundamental data. Note that our analysis may not factor in the latest price-sensitive company announcements or qualitative material. Simply Wall St has no position in any stocks mentioned.
About SEHK:535
Gemdale Properties and Investment
An investment holding company, engages in the property investment, development, and management activities in Mainland China.
Slightly overvalued with imperfect balance sheet.
Similar Companies
Market Insights

Advertisement
Weekly Picks
RO


RockeTeller on Santacruz Silver Mining ·
Crazy Undervalued 42 Baggers Silver Play (Active & Running Mine)
Fair Value:CA$8696.4% undervalued
38 followersusers have followed this narrative
6 commentsusers have commented on this narrative
10 likesusers have liked this narrative
RO


Robbo on Fiducian Group ·
Fiducian: Compliance Clouds or Value Opportunity?
Fair Value:AU$126.1% undervalued
4 followersusers have followed this narrative
0 commentsusers have commented on this narrative
0 likesusers have liked this narrative
WO

woodworthfund on Willamette Valley Vineyards ·
Willamette Valley Vineyards (WVVI): Not-So-Great Value
Fair Value:US$244.5% overvalued
6 followersusers have followed this narrative
0 commentsusers have commented on this narrative
1 likeusers have liked this narrative
Recently Updated Narratives
FU

FundamentallySarcastic on Credit Corp Group ·
Moderation and Stabilisation: HOLD: Fair Price based on a 4-year Cycle is $12.08
Fair Value:AU$12.6411.4% overvalued
1 followerusers have followed this narrative
0 commentsusers have commented on this narrative
0 likesusers have liked this narrative
MA


MarkoVT on Alphabet ·
Positioned globally, partnered locally
Fair Value:US$390.1918.1% undervalued
2 followersusers have followed this narrative
0 commentsusers have commented on this narrative
0 likesusers have liked this narrative
JO


JohnJ on Worldline ·
When will fraudsters be investigated in depth. Fraud was ongoing in France too.
Fair Value:€0.5190.0% overvalued
1 followerusers have followed this narrative
0 commentsusers have commented on this narrative
0 likesusers have liked this narrative
Popular Narratives
TH


TheWallstreetKing on MicroVision ·
MicroVision will explode future revenue by 380.37% with a vision towards success
Fair Value:US$6098.5% undervalued
114 followersusers have followed this narrative
11 commentsusers have commented on this narrative
22 likesusers have liked this narrative
AN


AnalystConsensusTarget on NVIDIA ·
NVDA: Expanding AI Demand Will Drive Major Data Center Investments Through 2026
Fair Value:US$250.3928.3% undervalued
952 followersusers have followed this narrative
6 commentsusers have commented on this narrative
25 likesusers have liked this narrative
OS

oscargarcia on Alphabet ·
The company that turned a verb into a global necessity and basically runs the modern internet, digital ads, smartphones, maps, and AI.
Fair Value:US$3406.0% undervalued
148 followersusers have followed this narrative
6 commentsusers have commented on this narrative
18 likesusers have liked this narrative

