- Hong Kong
- /
- Real Estate
- /
- SEHK:1997
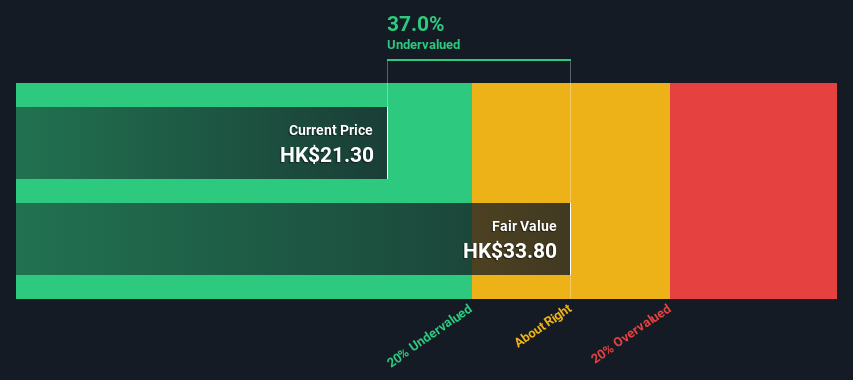
An Intrinsic Calculation For Wharf Real Estate Investment Company Limited (HKG:1997) Suggests It's 37% Undervalued


Key Insights
- The projected fair value for Wharf Real Estate Investment is HK$33.80 based on 2 Stage Free Cash Flow to Equity
- Wharf Real Estate Investment's HK$21.30 share price signals that it might be 37% undervalued
- The HK$30.87 analyst price target for 1997 is 8.7% less than our estimate of fair value
Today we will run through one way of estimating the intrinsic value of Wharf Real Estate Investment Company Limited (HKG:1997) by projecting its future cash flows and then discounting them to today's value. The Discounted Cash Flow (DCF) model is the tool we will apply to do this. Models like these may appear beyond the comprehension of a lay person, but they're fairly easy to follow.
We generally believe that a company's value is the present value of all of the cash it will generate in the future. However, a DCF is just one valuation metric among many, and it is not without flaws. Anyone interested in learning a bit more about intrinsic value should have a read of the Simply Wall St analysis model.
View our latest analysis for Wharf Real Estate Investment
What's The Estimated Valuation?
We're using the 2-stage growth model, which simply means we take in account two stages of company's growth. In the initial period the company may have a higher growth rate and the second stage is usually assumed to have a stable growth rate. In the first stage we need to estimate the cash flows to the business over the next ten years. Where possible we use analyst estimates, but when these aren't available we extrapolate the previous free cash flow (FCF) from the last estimate or reported value. We assume companies with shrinking free cash flow will slow their rate of shrinkage, and that companies with growing free cash flow will see their growth rate slow, over this period. We do this to reflect that growth tends to slow more in the early years than it does in later years.
Generally we assume that a dollar today is more valuable than a dollar in the future, and so the sum of these future cash flows is then discounted to today's value:
10-year free cash flow (FCF) forecast
| 2025 | 2026 | 2027 | 2028 | 2029 | 2030 | 2031 | 2032 | 2033 | 2034 | |
| Levered FCF (HK$, Millions) | HK$7.47b | HK$7.80b | HK$8.07b | HK$8.31b | HK$8.54b | HK$8.76b | HK$8.98b | HK$9.19b | HK$9.40b | HK$9.61b |
| Growth Rate Estimate Source | Analyst x2 | Analyst x2 | Est @ 3.41% | Est @ 3.03% | Est @ 2.77% | Est @ 2.58% | Est @ 2.45% | Est @ 2.36% | Est @ 2.30% | Est @ 2.25% |
| Present Value (HK$, Millions) Discounted @ 9.8% | HK$6.8k | HK$6.5k | HK$6.1k | HK$5.7k | HK$5.4k | HK$5.0k | HK$4.7k | HK$4.3k | HK$4.1k | HK$3.8k |
("Est" = FCF growth rate estimated by Simply Wall St)
Present Value of 10-year Cash Flow (PVCF) = HK$52b
The second stage is also known as Terminal Value, this is the business's cash flow after the first stage. The Gordon Growth formula is used to calculate Terminal Value at a future annual growth rate equal to the 5-year average of the 10-year government bond yield of 2.2%. We discount the terminal cash flows to today's value at a cost of equity of 9.8%.
Terminal Value (TV)= FCF2034 × (1 + g) ÷ (r – g) = HK$9.6b× (1 + 2.2%) ÷ (9.8%– 2.2%) = HK$128b
Present Value of Terminal Value (PVTV)= TV / (1 + r)10= HK$128b÷ ( 1 + 9.8%)10= HK$50b
The total value is the sum of cash flows for the next ten years plus the discounted terminal value, which results in the Total Equity Value, which in this case is HK$103b. In the final step we divide the equity value by the number of shares outstanding. Compared to the current share price of HK$21.3, the company appears quite good value at a 37% discount to where the stock price trades currently. Remember though, that this is just an approximate valuation, and like any complex formula - garbage in, garbage out.
The Assumptions
Now the most important inputs to a discounted cash flow are the discount rate, and of course, the actual cash flows. If you don't agree with these result, have a go at the calculation yourself and play with the assumptions. The DCF also does not consider the possible cyclicality of an industry, or a company's future capital requirements, so it does not give a full picture of a company's potential performance. Given that we are looking at Wharf Real Estate Investment as potential shareholders, the cost of equity is used as the discount rate, rather than the cost of capital (or weighted average cost of capital, WACC) which accounts for debt. In this calculation we've used 9.8%, which is based on a levered beta of 1.397. Beta is a measure of a stock's volatility, compared to the market as a whole. We get our beta from the industry average beta of globally comparable companies, with an imposed limit between 0.8 and 2.0, which is a reasonable range for a stable business.
SWOT Analysis for Wharf Real Estate Investment
- Debt is well covered by earnings.
- Dividends are covered by earnings and cash flows.
- Dividend is low compared to the top 25% of dividend payers in the Real Estate market.
- Annual earnings are forecast to grow for the next 3 years.
- Trading below our estimate of fair value by more than 20%.
- Debt is not well covered by operating cash flow.
- Annual earnings are forecast to grow slower than the Hong Kong market.
Next Steps:
Valuation is only one side of the coin in terms of building your investment thesis, and it shouldn't be the only metric you look at when researching a company. The DCF model is not a perfect stock valuation tool. Preferably you'd apply different cases and assumptions and see how they would impact the company's valuation. If a company grows at a different rate, or if its cost of equity or risk free rate changes sharply, the output can look very different. Can we work out why the company is trading at a discount to intrinsic value? For Wharf Real Estate Investment, we've compiled three additional factors you should further examine:
- Risks: For example, we've discovered 2 warning signs for Wharf Real Estate Investment that you should be aware of before investing here.
- Future Earnings: How does 1997's growth rate compare to its peers and the wider market? Dig deeper into the analyst consensus number for the upcoming years by interacting with our free analyst growth expectation chart.
- Other Solid Businesses: Low debt, high returns on equity and good past performance are fundamental to a strong business. Why not explore our interactive list of stocks with solid business fundamentals to see if there are other companies you may not have considered!
PS. Simply Wall St updates its DCF calculation for every Hong Kong stock every day, so if you want to find the intrinsic value of any other stock just search here.
Valuation is complex, but we're here to simplify it.
Discover if Wharf Real Estate Investment might be undervalued or overvalued with our detailed analysis, featuring fair value estimates, potential risks, dividends, insider trades, and its financial condition.
Access Free AnalysisHave feedback on this article? Concerned about the content? Get in touch with us directly. Alternatively, email editorial-team (at) simplywallst.com.
This article by Simply Wall St is general in nature. We provide commentary based on historical data and analyst forecasts only using an unbiased methodology and our articles are not intended to be financial advice. It does not constitute a recommendation to buy or sell any stock, and does not take account of your objectives, or your financial situation. We aim to bring you long-term focused analysis driven by fundamental data. Note that our analysis may not factor in the latest price-sensitive company announcements or qualitative material. Simply Wall St has no position in any stocks mentioned.
Have feedback on this article? Concerned about the content? Get in touch with us directly. Alternatively, email editorial-team@simplywallst.com
About SEHK:1997
Wharf Real Estate Investment
An investment holding company, invests in, develops, owns, and operates properties and hotels in Hong Kong, Mainland China, and Singapore.
Moderate growth potential and slightly overvalued.
Similar Companies
Market Insights

Community Narratives

