
Advertisement
- Hong Kong
- /
- Real Estate
- /
- SEHK:1778
Some Colour Life Services Group Co., Limited (HKG:1778) Shareholders Look For Exit As Shares Take 26% Pounding
To the annoyance of some shareholders, Colour Life Services Group Co., Limited (HKG:1778) shares are down a considerable 26% in the last month, which continues a horrid run for the company. Longer-term shareholders will rue the drop in the share price, since it's now virtually flat for the year after a promising few quarters.
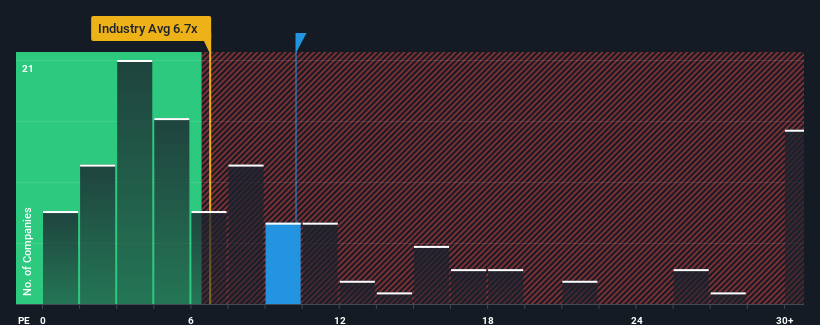
In spite of the heavy fall in price, there still wouldn't be many who think Colour Life Services Group's price-to-earnings (or "P/E") ratio of 10.2x is worth a mention when the median P/E in Hong Kong is similar at about 9x. Although, it's not wise to simply ignore the P/E without explanation as investors may be disregarding a distinct opportunity or a costly mistake.
As an illustration, earnings have deteriorated at Colour Life Services Group over the last year, which is not ideal at all. It might be that many expect the company to put the disappointing earnings performance behind them over the coming period, which has kept the P/E from falling. If not, then existing shareholders may be a little nervous about the viability of the share price.
Check out our latest analysis for Colour Life Services Group
Does Growth Match The P/E?
Colour Life Services Group's P/E ratio would be typical for a company that's only expected to deliver moderate growth, and importantly, perform in line with the market.
Taking a look back first, the company's earnings per share growth last year wasn't something to get excited about as it posted a disappointing decline of 27%. This means it has also seen a slide in earnings over the longer-term as EPS is down 96% in total over the last three years. Therefore, it's fair to say the earnings growth recently has been undesirable for the company.
Weighing that medium-term earnings trajectory against the broader market's one-year forecast for expansion of 21% shows it's an unpleasant look.
With this information, we find it concerning that Colour Life Services Group is trading at a fairly similar P/E to the market. Apparently many investors in the company are way less bearish than recent times would indicate and aren't willing to let go of their stock right now. There's a good chance existing shareholders are setting themselves up for future disappointment if the P/E falls to levels more in line with the recent negative growth rates.
The Final Word
Colour Life Services Group's plummeting stock price has brought its P/E right back to the rest of the market. Using the price-to-earnings ratio alone to determine if you should sell your stock isn't sensible, however it can be a practical guide to the company's future prospects.
Our examination of Colour Life Services Group revealed its shrinking earnings over the medium-term aren't impacting its P/E as much as we would have predicted, given the market is set to grow. When we see earnings heading backwards and underperforming the market forecasts, we suspect the share price is at risk of declining, sending the moderate P/E lower. If recent medium-term earnings trends continue, it will place shareholders' investments at risk and potential investors in danger of paying an unnecessary premium.
Having said that, be aware Colour Life Services Group is showing 5 warning signs in our investment analysis, and 1 of those shouldn't be ignored.
Of course, you might also be able to find a better stock than Colour Life Services Group. So you may wish to see this free collection of other companies that have reasonable P/E ratios and have grown earnings strongly.
New: AI Stock Screener & Alerts
Our new AI Stock Screener scans the market every day to uncover opportunities.
• Dividend Powerhouses (3%+ Yield)
• Undervalued Small Caps with Insider Buying
• High growth Tech and AI Companies
Or build your own from over 50 metrics.
Have feedback on this article? Concerned about the content? Get in touch with us directly. Alternatively, email editorial-team (at) simplywallst.com.
This article by Simply Wall St is general in nature. We provide commentary based on historical data and analyst forecasts only using an unbiased methodology and our articles are not intended to be financial advice. It does not constitute a recommendation to buy or sell any stock, and does not take account of your objectives, or your financial situation. We aim to bring you long-term focused analysis driven by fundamental data. Note that our analysis may not factor in the latest price-sensitive company announcements or qualitative material. Simply Wall St has no position in any stocks mentioned.
About SEHK:1778
Colour Life Services Group
Provides property management and community services in the People's Republic of China.
Flawless balance sheet with slight risk.
Market Insights

Advertisement
Community Narratives
The company that turned a verb into a global necessity and basically runs the modern internet, digital ads, smartphones, maps, and AI.
Fair Value US$300.00|6.3% undervalued
OS
Community Contributor
Flowers Foods Pays A Fair Price For Health
Fair Value US$16.12|26.0% undervalued
NV
Community Contributor
TMX Group will thrive with 33.3% profit margin and enduring market moat
Fair Value CA$49.90|3.7% overvalued
LI
Community Contributor