Health Check: How Prudently Does InnoCare Pharma (HKG:9969) Use Debt?


Warren Buffett famously said, 'Volatility is far from synonymous with risk.' It's only natural to consider a company's balance sheet when you examine how risky it is, since debt is often involved when a business collapses. Importantly, InnoCare Pharma Limited (HKG:9969) does carry debt. But the real question is whether this debt is making the company risky.
When Is Debt A Problem?
Debt and other liabilities become risky for a business when it cannot easily fulfill those obligations, either with free cash flow or by raising capital at an attractive price. Ultimately, if the company can't fulfill its legal obligations to repay debt, shareholders could walk away with nothing. However, a more usual (but still expensive) situation is where a company must dilute shareholders at a cheap share price simply to get debt under control. Of course, plenty of companies use debt to fund growth, without any negative consequences. The first thing to do when considering how much debt a business uses is to look at its cash and debt together.
View our latest analysis for InnoCare Pharma
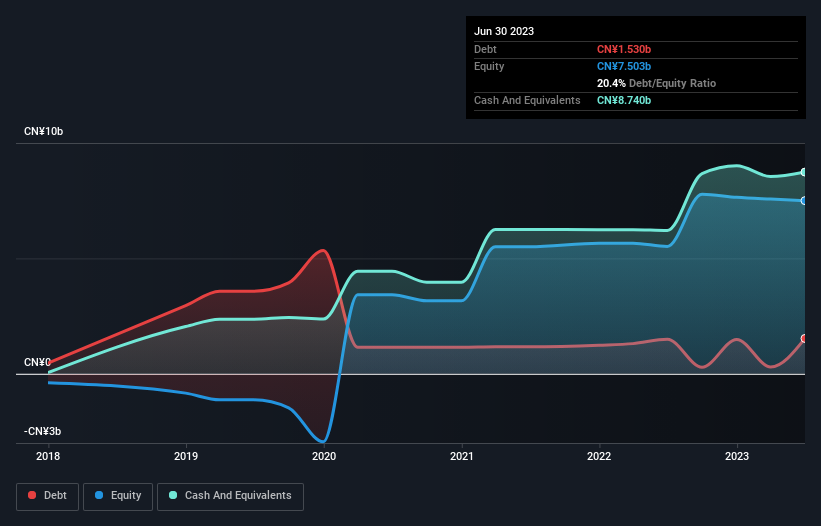
How Much Debt Does InnoCare Pharma Carry?
As you can see below, InnoCare Pharma had CN¥1.53b of debt, at June 2023, which is about the same as the year before. You can click the chart for greater detail. But it also has CN¥8.74b in cash to offset that, meaning it has CN¥7.21b net cash.
How Healthy Is InnoCare Pharma's Balance Sheet?
We can see from the most recent balance sheet that InnoCare Pharma had liabilities of CN¥2.06b falling due within a year, and liabilities of CN¥630.1m due beyond that. Offsetting these obligations, it had cash of CN¥8.74b as well as receivables valued at CN¥209.8m due within 12 months. So it actually has CN¥6.26b more liquid assets than total liabilities.
This luscious liquidity implies that InnoCare Pharma's balance sheet is sturdy like a giant sequoia tree. Having regard to this fact, we think its balance sheet is as strong as an ox. Simply put, the fact that InnoCare Pharma has more cash than debt is arguably a good indication that it can manage its debt safely. The balance sheet is clearly the area to focus on when you are analysing debt. But ultimately the future profitability of the business will decide if InnoCare Pharma can strengthen its balance sheet over time. So if you're focused on the future you can check out this free report showing analyst profit forecasts.
Over 12 months, InnoCare Pharma made a loss at the EBIT level, and saw its revenue drop to CN¥757m, which is a fall of 36%. That makes us nervous, to say the least.
So How Risky Is InnoCare Pharma?
We have no doubt that loss making companies are, in general, riskier than profitable ones. And in the last year InnoCare Pharma had an earnings before interest and tax (EBIT) loss, truth be told. And over the same period it saw negative free cash outflow of CN¥892m and booked a CN¥867m accounting loss. While this does make the company a bit risky, it's important to remember it has net cash of CN¥7.21b. That kitty means the company can keep spending for growth for at least two years, at current rates. Overall, its balance sheet doesn't seem overly risky, at the moment, but we're always cautious until we see the positive free cash flow. When we look at a riskier company, we like to check how their profits (or losses) are trending over time. Today, we're providing readers this interactive graph showing how InnoCare Pharma's profit, revenue, and operating cashflow have changed over the last few years.
If, after all that, you're more interested in a fast growing company with a rock-solid balance sheet, then check out our list of net cash growth stocks without delay.
New: AI Stock Screener & Alerts
Our new AI Stock Screener scans the market every day to uncover opportunities.
• Dividend Powerhouses (3%+ Yield)
• Undervalued Small Caps with Insider Buying
• High growth Tech and AI Companies
Or build your own from over 50 metrics.
Have feedback on this article? Concerned about the content? Get in touch with us directly. Alternatively, email editorial-team (at) simplywallst.com.
This article by Simply Wall St is general in nature. We provide commentary based on historical data and analyst forecasts only using an unbiased methodology and our articles are not intended to be financial advice. It does not constitute a recommendation to buy or sell any stock, and does not take account of your objectives, or your financial situation. We aim to bring you long-term focused analysis driven by fundamental data. Note that our analysis may not factor in the latest price-sensitive company announcements or qualitative material. Simply Wall St has no position in any stocks mentioned.
About SEHK:9969
InnoCare Pharma
A biopharmaceutical company, engages in discovering, developing, and commercializing drugs for the treatment of cancer and autoimmune diseases in China.
Excellent balance sheet and slightly overvalued.
Similar Companies
Market Insights

Community Narratives

