
Advertisement
YiChang HEC ChangJiang Pharmaceutical Co., Ltd.'s (HKG:1558) P/S Is Still On The Mark Following 33% Share Price Bounce

YiChang HEC ChangJiang Pharmaceutical Co., Ltd. (HKG:1558) shares have had a really impressive month, gaining 33% after a shaky period beforehand. Looking back a bit further, it's encouraging to see the stock is up 39% in the last year.
In spite of the firm bounce in price, it's still not a stretch to say that YiChang HEC ChangJiang Pharmaceutical's price-to-sales (or "P/S") ratio of 1.6x right now seems quite "middle-of-the-road" compared to the Pharmaceuticals industry in Hong Kong, where the median P/S ratio is around 1.3x. However, investors might be overlooking a clear opportunity or potential setback if there is no rational basis for the P/S.
Check out our latest analysis for YiChang HEC ChangJiang Pharmaceutical
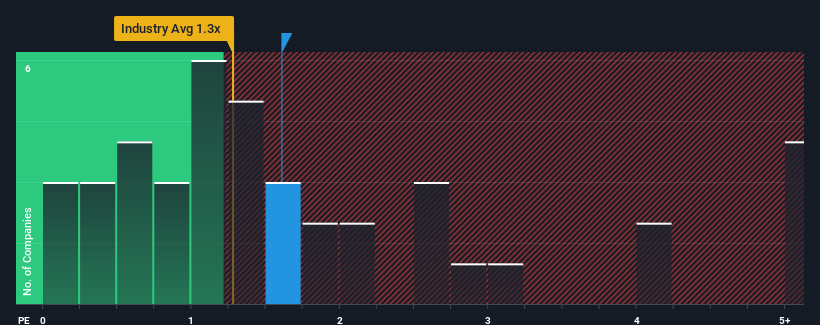
How YiChang HEC ChangJiang Pharmaceutical Has Been Performing
With revenue growth that's superior to most other companies of late, YiChang HEC ChangJiang Pharmaceutical has been doing relatively well. It might be that many expect the strong revenue performance to wane, which has kept the P/S ratio from rising. If the company manages to stay the course, then investors should be rewarded with a share price that matches its revenue figures.
Want the full picture on analyst estimates for the company? Then our free report on YiChang HEC ChangJiang Pharmaceutical will help you uncover what's on the horizon.How Is YiChang HEC ChangJiang Pharmaceutical's Revenue Growth Trending?
In order to justify its P/S ratio, YiChang HEC ChangJiang Pharmaceutical would need to produce growth that's similar to the industry.
Retrospectively, the last year delivered an exceptional 182% gain to the company's top line. As a result, it also grew revenue by 8.1% in total over the last three years. Accordingly, shareholders would have probably been satisfied with the medium-term rates of revenue growth.
Shifting to the future, estimates from the dual analysts covering the company suggest revenue should grow by 15% over the next year. That's shaping up to be similar to the 14% growth forecast for the broader industry.
With this in mind, it makes sense that YiChang HEC ChangJiang Pharmaceutical's P/S is closely matching its industry peers. It seems most investors are expecting to see average future growth and are only willing to pay a moderate amount for the stock.
The Bottom Line On YiChang HEC ChangJiang Pharmaceutical's P/S
YiChang HEC ChangJiang Pharmaceutical's stock has a lot of momentum behind it lately, which has brought its P/S level with the rest of the industry. Using the price-to-sales ratio alone to determine if you should sell your stock isn't sensible, however it can be a practical guide to the company's future prospects.
A YiChang HEC ChangJiang Pharmaceutical's P/S seems about right to us given the knowledge that analysts are forecasting a revenue outlook that is similar to the Pharmaceuticals industry. At this stage investors feel the potential for an improvement or deterioration in revenue isn't great enough to push P/S in a higher or lower direction. If all things remain constant, the possibility of a drastic share price movement remains fairly remote.
The company's balance sheet is another key area for risk analysis. Our free balance sheet analysis for YiChang HEC ChangJiang Pharmaceutical with six simple checks will allow you to discover any risks that could be an issue.
If strong companies turning a profit tickle your fancy, then you'll want to check out this free list of interesting companies that trade on a low P/E (but have proven they can grow earnings).
New: Manage All Your Stock Portfolios in One Place
We've created the ultimate portfolio companion for stock investors, and it's free.
• Connect an unlimited number of Portfolios and see your total in one currency
• Be alerted to new Warning Signs or Risks via email or mobile
• Track the Fair Value of your stocks
Have feedback on this article? Concerned about the content? Get in touch with us directly. Alternatively, email editorial-team (at) simplywallst.com.
This article by Simply Wall St is general in nature. We provide commentary based on historical data and analyst forecasts only using an unbiased methodology and our articles are not intended to be financial advice. It does not constitute a recommendation to buy or sell any stock, and does not take account of your objectives, or your financial situation. We aim to bring you long-term focused analysis driven by fundamental data. Note that our analysis may not factor in the latest price-sensitive company announcements or qualitative material. Simply Wall St has no position in any stocks mentioned.
About SEHK:1558
YiChang HEC ChangJiang Pharmaceutical
YiChang HEC ChangJiang Pharmaceutical Co., Ltd.
Excellent balance sheet and fair value.
Market Insights

Advertisement
Community Narratives

Apple: A Dying Star with an Overpriced Valuation
Fair Value US$177.34|19.7% overvalued
IN
Community Contributor
Avino a case for USD$20 per share within 5 years (assuming $3,500 gold, $100 silver and $4 copper).
Fair Value CA$26.79|87.9% undervalued
AG
Community Contributor
Riding the Defense Boom RENK Sees Revenue Climb at 15% CAGR by FY 2029
Fair Value €69.87|24.5% undervalued
CH
Community Contributor