Lacklustre Performance Is Driving CANbridge Pharmaceuticals Inc.'s (HKG:1228) 28% Price Drop

Unfortunately for some shareholders, the CANbridge Pharmaceuticals Inc. (HKG:1228) share price has dived 28% in the last thirty days, prolonging recent pain. The recent drop completes a disastrous twelve months for shareholders, who are sitting on a 87% loss during that time.
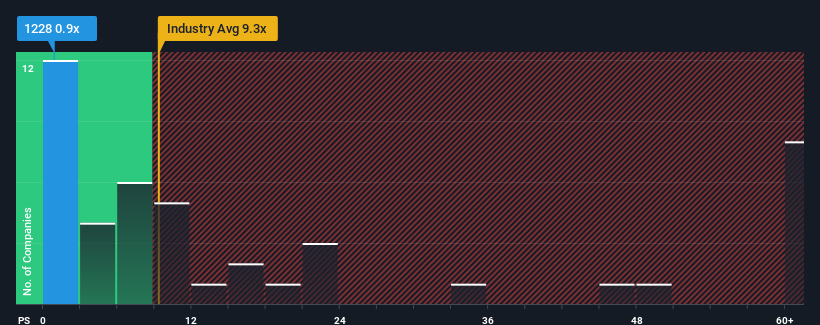
Since its price has dipped substantially, CANbridge Pharmaceuticals may look like a strong buying opportunity at present with its price-to-sales (or "P/S") ratio of 0.9x, considering almost half of all companies in the Biotechs industry in Hong Kong have P/S ratios greater than 9.3x and even P/S higher than 23x aren't out of the ordinary. Although, it's not wise to just take the P/S at face value as there may be an explanation why it's so limited.
Check out our latest analysis for CANbridge Pharmaceuticals

What Does CANbridge Pharmaceuticals' Recent Performance Look Like?
With revenue growth that's inferior to most other companies of late, CANbridge Pharmaceuticals has been relatively sluggish. Perhaps the market is expecting the current trend of poor revenue growth to continue, which has kept the P/S suppressed. If you still like the company, you'd be hoping revenue doesn't get any worse and that you could pick up some stock while it's out of favour.
Want the full picture on analyst estimates for the company? Then our free report on CANbridge Pharmaceuticals will help you uncover what's on the horizon.What Are Revenue Growth Metrics Telling Us About The Low P/S?
The only time you'd be truly comfortable seeing a P/S as depressed as CANbridge Pharmaceuticals' is when the company's growth is on track to lag the industry decidedly.
If we review the last year of revenue growth, the company posted a terrific increase of 30%. Spectacularly, three year revenue growth has ballooned by several orders of magnitude, thanks in part to the last 12 months of revenue growth. So we can start by confirming that the company has done a tremendous job of growing revenue over that time.
Turning to the outlook, the next three years should generate growth of 43% each year as estimated by the one analyst watching the company. With the industry predicted to deliver 50% growth per year, the company is positioned for a weaker revenue result.
With this information, we can see why CANbridge Pharmaceuticals is trading at a P/S lower than the industry. Apparently many shareholders weren't comfortable holding on while the company is potentially eyeing a less prosperous future.
What We Can Learn From CANbridge Pharmaceuticals' P/S?
Having almost fallen off a cliff, CANbridge Pharmaceuticals' share price has pulled its P/S way down as well. While the price-to-sales ratio shouldn't be the defining factor in whether you buy a stock or not, it's quite a capable barometer of revenue expectations.
As we suspected, our examination of CANbridge Pharmaceuticals' analyst forecasts revealed that its inferior revenue outlook is contributing to its low P/S. Shareholders' pessimism on the revenue prospects for the company seems to be the main contributor to the depressed P/S. The company will need a change of fortune to justify the P/S rising higher in the future.
There are also other vital risk factors to consider and we've discovered 5 warning signs for CANbridge Pharmaceuticals (3 make us uncomfortable!) that you should be aware of before investing here.
It's important to make sure you look for a great company, not just the first idea you come across. So if growing profitability aligns with your idea of a great company, take a peek at this free list of interesting companies with strong recent earnings growth (and a low P/E).
New: AI Stock Screener & Alerts
Our new AI Stock Screener scans the market every day to uncover opportunities.
• Dividend Powerhouses (3%+ Yield)
• Undervalued Small Caps with Insider Buying
• High growth Tech and AI Companies
Or build your own from over 50 metrics.
Have feedback on this article? Concerned about the content? Get in touch with us directly. Alternatively, email editorial-team (at) simplywallst.com.
This article by Simply Wall St is general in nature. We provide commentary based on historical data and analyst forecasts only using an unbiased methodology and our articles are not intended to be financial advice. It does not constitute a recommendation to buy or sell any stock, and does not take account of your objectives, or your financial situation. We aim to bring you long-term focused analysis driven by fundamental data. Note that our analysis may not factor in the latest price-sensitive company announcements or qualitative material. Simply Wall St has no position in any stocks mentioned.
Have feedback on this article? Concerned about the content? Get in touch with us directly. Alternatively, email editorial-team@simplywallst.com
About SEHK:1228
CANbridge Pharmaceuticals
A biopharmaceutical company, engages in the research, development, and commercialization of therapies for rare diseases and oncology indications worldwide.
Low and slightly overvalued.
Market Insights
Community Narratives


