CSPC Pharmaceutical Group Limited (HKG:1093) Shares Could Be 49% Below Their Intrinsic Value Estimate


Key Insights
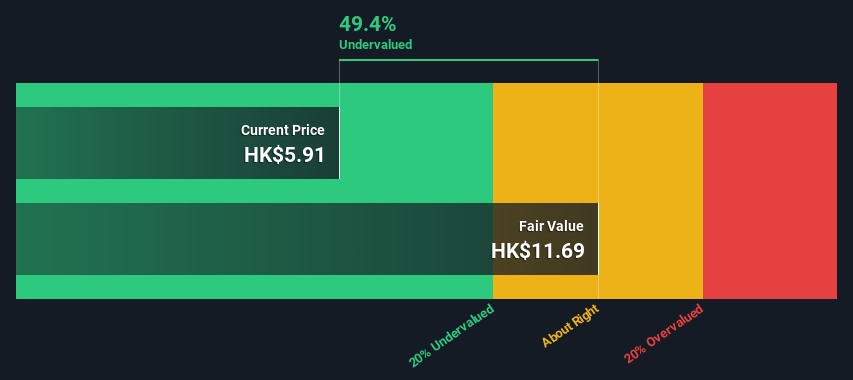
- The projected fair value for CSPC Pharmaceutical Group is HK$11.69 based on 2 Stage Free Cash Flow to Equity
- Current share price of HK$5.91 suggests CSPC Pharmaceutical Group is potentially 49% undervalued
- Our fair value estimate is 23% higher than CSPC Pharmaceutical Group's analyst price target of CN¥9.50
Today we'll do a simple run through of a valuation method used to estimate the attractiveness of CSPC Pharmaceutical Group Limited (HKG:1093) as an investment opportunity by taking the expected future cash flows and discounting them to their present value. We will take advantage of the Discounted Cash Flow (DCF) model for this purpose. Models like these may appear beyond the comprehension of a lay person, but they're fairly easy to follow.
Companies can be valued in a lot of ways, so we would point out that a DCF is not perfect for every situation. Anyone interested in learning a bit more about intrinsic value should have a read of the Simply Wall St analysis model.
See our latest analysis for CSPC Pharmaceutical Group
Step By Step Through The Calculation
We use what is known as a 2-stage model, which simply means we have two different periods of growth rates for the company's cash flows. Generally the first stage is higher growth, and the second stage is a lower growth phase. To start off with, we need to estimate the next ten years of cash flows. Where possible we use analyst estimates, but when these aren't available we extrapolate the previous free cash flow (FCF) from the last estimate or reported value. We assume companies with shrinking free cash flow will slow their rate of shrinkage, and that companies with growing free cash flow will see their growth rate slow, over this period. We do this to reflect that growth tends to slow more in the early years than it does in later years.
A DCF is all about the idea that a dollar in the future is less valuable than a dollar today, so we need to discount the sum of these future cash flows to arrive at a present value estimate:
10-year free cash flow (FCF) forecast
| 2024 | 2025 | 2026 | 2027 | 2028 | 2029 | 2030 | 2031 | 2032 | 2033 | |
| Levered FCF (CN¥, Millions) | CN¥6.10b | CN¥6.28b | CN¥6.18b | CN¥5.94b | CN¥6.72b | CN¥6.85b | CN¥6.97b | CN¥7.11b | CN¥7.24b | CN¥7.38b |
| Growth Rate Estimate Source | Analyst x10 | Analyst x9 | Analyst x3 | Analyst x4 | Analyst x3 | Est @ 1.82% | Est @ 1.86% | Est @ 1.89% | Est @ 1.92% | Est @ 1.93% |
| Present Value (CN¥, Millions) Discounted @ 6.8% | CN¥5.7k | CN¥5.5k | CN¥5.1k | CN¥4.6k | CN¥4.8k | CN¥4.6k | CN¥4.4k | CN¥4.2k | CN¥4.0k | CN¥3.8k |
("Est" = FCF growth rate estimated by Simply Wall St)
Present Value of 10-year Cash Flow (PVCF) = CN¥47b
We now need to calculate the Terminal Value, which accounts for all the future cash flows after this ten year period. For a number of reasons a very conservative growth rate is used that cannot exceed that of a country's GDP growth. In this case we have used the 5-year average of the 10-year government bond yield (2.0%) to estimate future growth. In the same way as with the 10-year 'growth' period, we discount future cash flows to today's value, using a cost of equity of 6.8%.
Terminal Value (TV)= FCF2033 × (1 + g) ÷ (r – g) = CN¥7.4b× (1 + 2.0%) ÷ (6.8%– 2.0%) = CN¥155b
Present Value of Terminal Value (PVTV)= TV / (1 + r)10= CN¥155b÷ ( 1 + 6.8%)10= CN¥80b
The total value, or equity value, is then the sum of the present value of the future cash flows, which in this case is CN¥127b. To get the intrinsic value per share, we divide this by the total number of shares outstanding. Compared to the current share price of HK$5.9, the company appears quite undervalued at a 49% discount to where the stock price trades currently. Remember though, that this is just an approximate valuation, and like any complex formula - garbage in, garbage out.
The Assumptions
The calculation above is very dependent on two assumptions. The first is the discount rate and the other is the cash flows. Part of investing is coming up with your own evaluation of a company's future performance, so try the calculation yourself and check your own assumptions. The DCF also does not consider the possible cyclicality of an industry, or a company's future capital requirements, so it does not give a full picture of a company's potential performance. Given that we are looking at CSPC Pharmaceutical Group as potential shareholders, the cost of equity is used as the discount rate, rather than the cost of capital (or weighted average cost of capital, WACC) which accounts for debt. In this calculation we've used 6.8%, which is based on a levered beta of 0.800. Beta is a measure of a stock's volatility, compared to the market as a whole. We get our beta from the industry average beta of globally comparable companies, with an imposed limit between 0.8 and 2.0, which is a reasonable range for a stable business.
SWOT Analysis for CSPC Pharmaceutical Group
- Debt is not viewed as a risk.
- Earnings growth over the past year underperformed the Pharmaceuticals industry.
- Dividend is low compared to the top 25% of dividend payers in the Pharmaceuticals market.
- Annual earnings are forecast to grow for the next 4 years.
- Good value based on P/E ratio and estimated fair value.
- Dividends are not covered by cash flow.
- Annual earnings are forecast to grow slower than the Hong Kong market.
Looking Ahead:
Valuation is only one side of the coin in terms of building your investment thesis, and it is only one of many factors that you need to assess for a company. It's not possible to obtain a foolproof valuation with a DCF model. Preferably you'd apply different cases and assumptions and see how they would impact the company's valuation. If a company grows at a different rate, or if its cost of equity or risk free rate changes sharply, the output can look very different. Why is the intrinsic value higher than the current share price? For CSPC Pharmaceutical Group, there are three additional elements you should further examine:
- Risks: Every company has them, and we've spotted 1 warning sign for CSPC Pharmaceutical Group you should know about.
- Future Earnings: How does 1093's growth rate compare to its peers and the wider market? Dig deeper into the analyst consensus number for the upcoming years by interacting with our free analyst growth expectation chart.
- Other Solid Businesses: Low debt, high returns on equity and good past performance are fundamental to a strong business. Why not explore our interactive list of stocks with solid business fundamentals to see if there are other companies you may not have considered!
PS. The Simply Wall St app conducts a discounted cash flow valuation for every stock on the SEHK every day. If you want to find the calculation for other stocks just search here.
New: AI Stock Screener & Alerts
Our new AI Stock Screener scans the market every day to uncover opportunities.
• Dividend Powerhouses (3%+ Yield)
• Undervalued Small Caps with Insider Buying
• High growth Tech and AI Companies
Or build your own from over 50 metrics.
Have feedback on this article? Concerned about the content? Get in touch with us directly. Alternatively, email editorial-team (at) simplywallst.com.
This article by Simply Wall St is general in nature. We provide commentary based on historical data and analyst forecasts only using an unbiased methodology and our articles are not intended to be financial advice. It does not constitute a recommendation to buy or sell any stock, and does not take account of your objectives, or your financial situation. We aim to bring you long-term focused analysis driven by fundamental data. Note that our analysis may not factor in the latest price-sensitive company announcements or qualitative material. Simply Wall St has no position in any stocks mentioned.
About SEHK:1093
CSPC Pharmaceutical Group
An investment holding company, engages in the research and development, manufacture, and sale of pharmaceutical products in the People’s Republic of China, other Asian regions, North America, Europe, and internationally.
Excellent balance sheet and good value.

