- Hong Kong
- /
- Entertainment
- /
- SEHK:9899
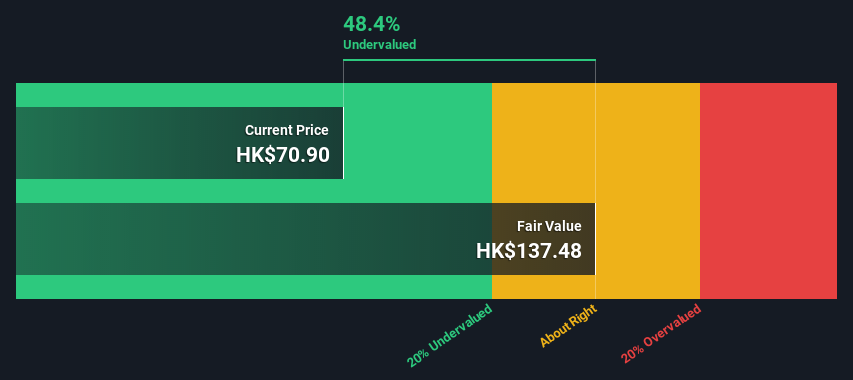
Is There An Opportunity With Cloud Music Inc.'s (HKG:9899) 48% Undervaluation?


In this article we are going to estimate the intrinsic value of Cloud Music Inc. (HKG:9899) by estimating the company's future cash flows and discounting them to their present value. One way to achieve this is by employing the Discounted Cash Flow (DCF) model. Before you think you won't be able to understand it, just read on! It's actually much less complex than you'd imagine.
Remember though, that there are many ways to estimate a company's value, and a DCF is just one method. For those who are keen learners of equity analysis, the Simply Wall St analysis model here may be something of interest to you.
Our analysis indicates that 9899 is potentially undervalued!
The Method
We are going to use a two-stage DCF model, which, as the name states, takes into account two stages of growth. The first stage is generally a higher growth period which levels off heading towards the terminal value, captured in the second 'steady growth' period. To start off with, we need to estimate the next ten years of cash flows. Where possible we use analyst estimates, but when these aren't available we extrapolate the previous free cash flow (FCF) from the last estimate or reported value. We assume companies with shrinking free cash flow will slow their rate of shrinkage, and that companies with growing free cash flow will see their growth rate slow, over this period. We do this to reflect that growth tends to slow more in the early years than it does in later years.
A DCF is all about the idea that a dollar in the future is less valuable than a dollar today, so we need to discount the sum of these future cash flows to arrive at a present value estimate:
10-year free cash flow (FCF) estimate
| 2023 | 2024 | 2025 | 2026 | 2027 | 2028 | 2029 | 2030 | 2031 | 2032 | |
| Levered FCF (CN¥, Millions) | -CN¥166.2m | CN¥143.3m | CN¥639.0m | CN¥974.7m | CN¥1.24b | CN¥1.48b | CN¥1.69b | CN¥1.87b | CN¥2.02b | CN¥2.14b |
| Growth Rate Estimate Source | Analyst x4 | Analyst x3 | Analyst x3 | Analyst x3 | Est @ 27.29% | Est @ 19.59% | Est @ 14.2% | Est @ 10.43% | Est @ 7.78% | Est @ 5.94% |
| Present Value (CN¥, Millions) Discounted @ 7.3% | -CN¥155 | CN¥124 | CN¥517 | CN¥735 | CN¥872 | CN¥972 | CN¥1.0k | CN¥1.1k | CN¥1.1k | CN¥1.1k |
("Est" = FCF growth rate estimated by Simply Wall St)
Present Value of 10-year Cash Flow (PVCF) = CN¥7.3b
The second stage is also known as Terminal Value, this is the business's cash flow after the first stage. For a number of reasons a very conservative growth rate is used that cannot exceed that of a country's GDP growth. In this case we have used the 5-year average of the 10-year government bond yield (1.6%) to estimate future growth. In the same way as with the 10-year 'growth' period, we discount future cash flows to today's value, using a cost of equity of 7.3%.
Terminal Value (TV)= FCF2032 × (1 + g) ÷ (r – g) = CN¥2.1b× (1 + 1.6%) ÷ (7.3%– 1.6%) = CN¥38b
Present Value of Terminal Value (PVTV)= TV / (1 + r)10= CN¥38b÷ ( 1 + 7.3%)10= CN¥19b
The total value, or equity value, is then the sum of the present value of the future cash flows, which in this case is CN¥26b. To get the intrinsic value per share, we divide this by the total number of shares outstanding. Compared to the current share price of HK$70.9, the company appears quite good value at a 48% discount to where the stock price trades currently. Valuations are imprecise instruments though, rather like a telescope - move a few degrees and end up in a different galaxy. Do keep this in mind.
The Assumptions
The calculation above is very dependent on two assumptions. The first is the discount rate and the other is the cash flows. Part of investing is coming up with your own evaluation of a company's future performance, so try the calculation yourself and check your own assumptions. The DCF also does not consider the possible cyclicality of an industry, or a company's future capital requirements, so it does not give a full picture of a company's potential performance. Given that we are looking at Cloud Music as potential shareholders, the cost of equity is used as the discount rate, rather than the cost of capital (or weighted average cost of capital, WACC) which accounts for debt. In this calculation we've used 7.3%, which is based on a levered beta of 0.953. Beta is a measure of a stock's volatility, compared to the market as a whole. We get our beta from the industry average beta of globally comparable companies, with an imposed limit between 0.8 and 2.0, which is a reasonable range for a stable business.
Next Steps:
Whilst important, the DCF calculation is only one of many factors that you need to assess for a company. The DCF model is not a perfect stock valuation tool. Preferably you'd apply different cases and assumptions and see how they would impact the company's valuation. For instance, if the terminal value growth rate is adjusted slightly, it can dramatically alter the overall result. Why is the intrinsic value higher than the current share price? For Cloud Music, we've put together three additional aspects you should assess:
- Risks: You should be aware of the 1 warning sign for Cloud Music we've uncovered before considering an investment in the company.
- Future Earnings: How does 9899's growth rate compare to its peers and the wider market? Dig deeper into the analyst consensus number for the upcoming years by interacting with our free analyst growth expectation chart.
- Other High Quality Alternatives: Do you like a good all-rounder? Explore our interactive list of high quality stocks to get an idea of what else is out there you may be missing!
PS. The Simply Wall St app conducts a discounted cash flow valuation for every stock on the SEHK every day. If you want to find the calculation for other stocks just search here.
Valuation is complex, but we're here to simplify it.
Discover if NetEase Cloud Music might be undervalued or overvalued with our detailed analysis, featuring fair value estimates, potential risks, dividends, insider trades, and its financial condition.
Access Free AnalysisHave feedback on this article? Concerned about the content? Get in touch with us directly. Alternatively, email editorial-team (at) simplywallst.com.
This article by Simply Wall St is general in nature. We provide commentary based on historical data and analyst forecasts only using an unbiased methodology and our articles are not intended to be financial advice. It does not constitute a recommendation to buy or sell any stock, and does not take account of your objectives, or your financial situation. We aim to bring you long-term focused analysis driven by fundamental data. Note that our analysis may not factor in the latest price-sensitive company announcements or qualitative material. Simply Wall St has no position in any stocks mentioned.
About SEHK:9899
NetEase Cloud Music
An investment holding company, engages in the operation of online platforms to provide music and social entertainment services in the People’s Republic of China.
Flawless balance sheet with solid track record.

