
Advertisement
- Hong Kong
- /
- Entertainment
- /
- SEHK:9890
Investors Still Aren't Entirely Convinced By ZX Inc.'s (HKG:9890) Revenues Despite 44% Price Jump
Those holding ZX Inc. (HKG:9890) shares would be relieved that the share price has rebounded 44% in the last thirty days, but it needs to keep going to repair the recent damage it has caused to investor portfolios. While recent buyers may be laughing, long-term holders might not be as pleased since the recent gain only brings the stock back to where it started a year ago.
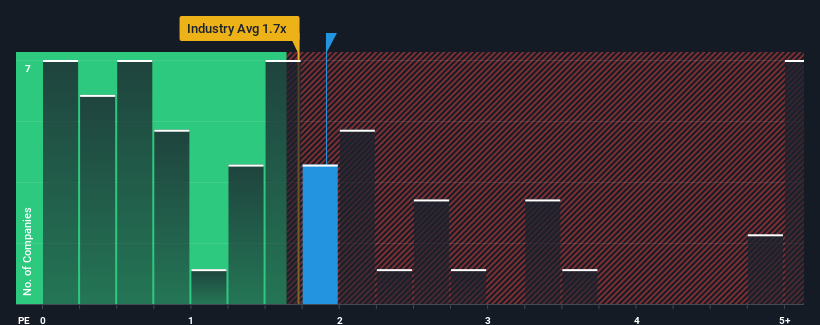
In spite of the firm bounce in price, you could still be forgiven for feeling indifferent about ZX's P/S ratio of 1.9x, since the median price-to-sales (or "P/S") ratio for the Entertainment industry in Hong Kong is also close to 1.7x. Although, it's not wise to simply ignore the P/S without explanation as investors may be disregarding a distinct opportunity or a costly mistake.
See our latest analysis for ZX
How ZX Has Been Performing
For instance, ZX's receding revenue in recent times would have to be some food for thought. Perhaps investors believe the recent revenue performance is enough to keep in line with the industry, which is keeping the P/S from dropping off. If you like the company, you'd at least be hoping this is the case so that you could potentially pick up some stock while it's not quite in favour.
Want the full picture on earnings, revenue and cash flow for the company? Then our free report on ZX will help you shine a light on its historical performance.Is There Some Revenue Growth Forecasted For ZX?
In order to justify its P/S ratio, ZX would need to produce growth that's similar to the industry.
Taking a look back first, the company's revenue growth last year wasn't something to get excited about as it posted a disappointing decline of 26%. Still, the latest three year period has seen an excellent 127% overall rise in revenue, in spite of its unsatisfying short-term performance. So we can start by confirming that the company has generally done a very good job of growing revenue over that time, even though it had some hiccups along the way.
Comparing that recent medium-term revenue trajectory with the industry's one-year growth forecast of 20% shows it's noticeably more attractive.
In light of this, it's curious that ZX's P/S sits in line with the majority of other companies. Apparently some shareholders believe the recent performance is at its limits and have been accepting lower selling prices.
What Does ZX's P/S Mean For Investors?
Its shares have lifted substantially and now ZX's P/S is back within range of the industry median. It's argued the price-to-sales ratio is an inferior measure of value within certain industries, but it can be a powerful business sentiment indicator.
We've established that ZX currently trades on a lower than expected P/S since its recent three-year growth is higher than the wider industry forecast. It'd be fair to assume that potential risks the company faces could be the contributing factor to the lower than expected P/S. While recent revenue trends over the past medium-term suggest that the risk of a price decline is low, investors appear to see the likelihood of revenue fluctuations in the future.
Before you settle on your opinion, we've discovered 5 warning signs for ZX (3 shouldn't be ignored!) that you should be aware of.
Of course, profitable companies with a history of great earnings growth are generally safer bets. So you may wish to see this free collection of other companies that have reasonable P/E ratios and have grown earnings strongly.
Valuation is complex, but we're here to simplify it.
Discover if Tanwan might be undervalued or overvalued with our detailed analysis, featuring fair value estimates, potential risks, dividends, insider trades, and its financial condition.
Access Free AnalysisHave feedback on this article? Concerned about the content? Get in touch with us directly. Alternatively, email editorial-team (at) simplywallst.com.
This article by Simply Wall St is general in nature. We provide commentary based on historical data and analyst forecasts only using an unbiased methodology and our articles are not intended to be financial advice. It does not constitute a recommendation to buy or sell any stock, and does not take account of your objectives, or your financial situation. We aim to bring you long-term focused analysis driven by fundamental data. Note that our analysis may not factor in the latest price-sensitive company announcements or qualitative material. Simply Wall St has no position in any stocks mentioned.
About SEHK:9890
Tanwan
Operates as a publisher of online game products in Mainland China, Hong Kong, and internationally.
Adequate balance sheet with acceptable track record.
Market Insights

Advertisement
Community Narratives
MicroVision will explode future revenue by 380.37% with a vision towards success
Fair Value US$60.00|98.4% undervalued
TH
Community Contributor
The Indispensable Artery for a New North American Economy
Fair Value CA$132.87|1.1% undervalued
TI
Community Contributor