
Advertisement
A Piece Of The Puzzle Missing From Crazy Sports Group Limited's (HKG:82) 31% Share Price Climb

Crazy Sports Group Limited (HKG:82) shares have had a really impressive month, gaining 31% after a shaky period beforehand. Unfortunately, the gains of the last month did little to right the losses of the last year with the stock still down 40% over that time.
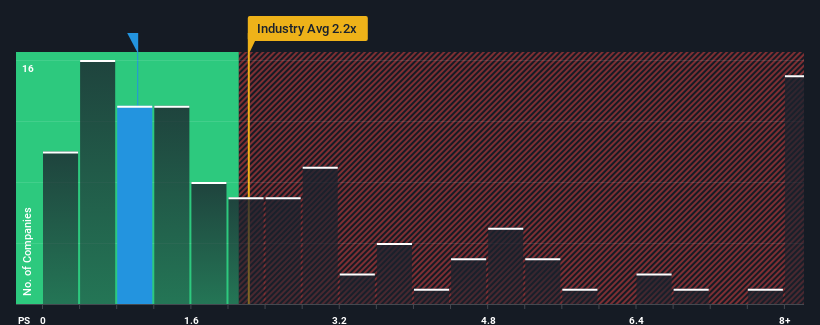
Although its price has surged higher, you could still be forgiven for feeling indifferent about Crazy Sports Group's P/S ratio of 1x, since the median price-to-sales (or "P/S") ratio for the Interactive Media and Services industry in Hong Kong is also close to 0.6x. While this might not raise any eyebrows, if the P/S ratio is not justified investors could be missing out on a potential opportunity or ignoring looming disappointment.
Check out our latest analysis for Crazy Sports Group
How Has Crazy Sports Group Performed Recently?
For example, consider that Crazy Sports Group's financial performance has been poor lately as its revenue has been in decline. One possibility is that the P/S is moderate because investors think the company might still do enough to be in line with the broader industry in the near future. If you like the company, you'd at least be hoping this is the case so that you could potentially pick up some stock while it's not quite in favour.
Although there are no analyst estimates available for Crazy Sports Group, take a look at this free data-rich visualisation to see how the company stacks up on earnings, revenue and cash flow.How Is Crazy Sports Group's Revenue Growth Trending?
The only time you'd be comfortable seeing a P/S like Crazy Sports Group's is when the company's growth is tracking the industry closely.
Taking a look back first, the company's revenue growth last year wasn't something to get excited about as it posted a disappointing decline of 30%. However, a few very strong years before that means that it was still able to grow revenue by an impressive 63% in total over the last three years. Accordingly, while they would have preferred to keep the run going, shareholders would definitely welcome the medium-term rates of revenue growth.
When compared to the industry's one-year growth forecast of 10%, the most recent medium-term revenue trajectory is noticeably more alluring
With this information, we find it interesting that Crazy Sports Group is trading at a fairly similar P/S compared to the industry. Apparently some shareholders believe the recent performance is at its limits and have been accepting lower selling prices.
The Final Word
Crazy Sports Group's stock has a lot of momentum behind it lately, which has brought its P/S level with the rest of the industry. Using the price-to-sales ratio alone to determine if you should sell your stock isn't sensible, however it can be a practical guide to the company's future prospects.
To our surprise, Crazy Sports Group revealed its three-year revenue trends aren't contributing to its P/S as much as we would have predicted, given they look better than current industry expectations. When we see strong revenue with faster-than-industry growth, we can only assume potential risks are what might be placing pressure on the P/S ratio. It appears some are indeed anticipating revenue instability, because the persistence of these recent medium-term conditions would normally provide a boost to the share price.
Before you settle on your opinion, we've discovered 1 warning sign for Crazy Sports Group that you should be aware of.
Of course, profitable companies with a history of great earnings growth are generally safer bets. So you may wish to see this free collection of other companies that have reasonable P/E ratios and have grown earnings strongly.
New: AI Stock Screener & Alerts
Our new AI Stock Screener scans the market every day to uncover opportunities.
• Dividend Powerhouses (3%+ Yield)
• Undervalued Small Caps with Insider Buying
• High growth Tech and AI Companies
Or build your own from over 50 metrics.
Have feedback on this article? Concerned about the content? Get in touch with us directly. Alternatively, email editorial-team (at) simplywallst.com.
This article by Simply Wall St is general in nature. We provide commentary based on historical data and analyst forecasts only using an unbiased methodology and our articles are not intended to be financial advice. It does not constitute a recommendation to buy or sell any stock, and does not take account of your objectives, or your financial situation. We aim to bring you long-term focused analysis driven by fundamental data. Note that our analysis may not factor in the latest price-sensitive company announcements or qualitative material. Simply Wall St has no position in any stocks mentioned.
About SEHK:82
Crazy Sports Group
An investment holding company, operates as a digital sports entertainment community operator in the People's Republic of China.
Fair value with mediocre balance sheet.
Market Insights

Advertisement
Community Narratives
Groundbreaking therapies that could change the treatment landscape for PTSD, fibromyalgia, MS & Alzheimer’s
Fair Value US$6.20|86.8% undervalued
CM
Community Contributor
DigitalOcean Will Grow 14% by Embracing AI with Paperspace Acquisition
Fair Value US$50.00|43.5% undervalued
NE
Community Contributor
Viant Technology: A Rising AdTech Challenger in the AI-Powered CTV Market
Fair Value US$38.61|61.4% undervalued
BL
Community Contributor
Volvo will Accelerate Forward into Electric and Autonomous Leadership in Five Years
Fair Value SEK 438.80|40.9% undervalued
UN
Community Contributor