
Advertisement
- Hong Kong
- /
- Entertainment
- /
- SEHK:491
Emperor Culture Group Limited (HKG:491) Soars 185% But It's A Story Of Risk Vs Reward

Emperor Culture Group Limited (HKG:491) shareholders would be excited to see that the share price has had a great month, posting a 185% gain and recovering from prior weakness. The last 30 days bring the annual gain to a very sharp 62%.
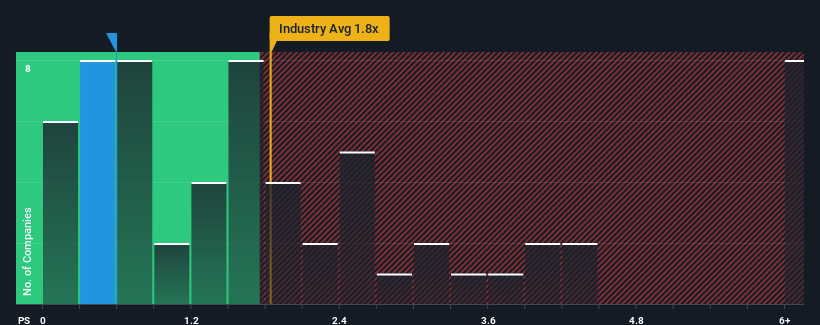
In spite of the firm bounce in price, Emperor Culture Group's price-to-sales (or "P/S") ratio of 0.6x might still make it look like a buy right now compared to the Entertainment industry in Hong Kong, where around half of the companies have P/S ratios above 1.8x and even P/S above 4x are quite common. Although, it's not wise to just take the P/S at face value as there may be an explanation why it's limited.
Check out our latest analysis for Emperor Culture Group
What Does Emperor Culture Group's Recent Performance Look Like?
With revenue growth that's exceedingly strong of late, Emperor Culture Group has been doing very well. It might be that many expect the strong revenue performance to degrade substantially, which has repressed the P/S ratio. Those who are bullish on Emperor Culture Group will be hoping that this isn't the case, so that they can pick up the stock at a lower valuation.
Want the full picture on earnings, revenue and cash flow for the company? Then our free report on Emperor Culture Group will help you shine a light on its historical performance.Do Revenue Forecasts Match The Low P/S Ratio?
The only time you'd be truly comfortable seeing a P/S as low as Emperor Culture Group's is when the company's growth is on track to lag the industry.
If we review the last year of revenue growth, the company posted a terrific increase of 51%. Spectacularly, three year revenue growth has ballooned by several orders of magnitude, thanks in part to the last 12 months of revenue growth. So we can start by confirming that the company has done a tremendous job of growing revenue over that time.
Comparing that recent medium-term revenue trajectory with the industry's one-year growth forecast of 20% shows it's noticeably more attractive.
With this in mind, we find it intriguing that Emperor Culture Group's P/S isn't as high compared to that of its industry peers. Apparently some shareholders believe the recent performance has exceeded its limits and have been accepting significantly lower selling prices.
What We Can Learn From Emperor Culture Group's P/S?
The latest share price surge wasn't enough to lift Emperor Culture Group's P/S close to the industry median. We'd say the price-to-sales ratio's power isn't primarily as a valuation instrument but rather to gauge current investor sentiment and future expectations.
We're very surprised to see Emperor Culture Group currently trading on a much lower than expected P/S since its recent three-year growth is higher than the wider industry forecast. Potential investors that are sceptical over continued revenue performance may be preventing the P/S ratio from matching previous strong performance. At least price risks look to be very low if recent medium-term revenue trends continue, but investors seem to think future revenue could see a lot of volatility.
It is also worth noting that we have found 5 warning signs for Emperor Culture Group (4 shouldn't be ignored!) that you need to take into consideration.
If these risks are making you reconsider your opinion on Emperor Culture Group, explore our interactive list of high quality stocks to get an idea of what else is out there.
Valuation is complex, but we're here to simplify it.
Discover if Emperor Culture Group might be undervalued or overvalued with our detailed analysis, featuring fair value estimates, potential risks, dividends, insider trades, and its financial condition.
Access Free AnalysisHave feedback on this article? Concerned about the content? Get in touch with us directly. Alternatively, email editorial-team (at) simplywallst.com.
This article by Simply Wall St is general in nature. We provide commentary based on historical data and analyst forecasts only using an unbiased methodology and our articles are not intended to be financial advice. It does not constitute a recommendation to buy or sell any stock, and does not take account of your objectives, or your financial situation. We aim to bring you long-term focused analysis driven by fundamental data. Note that our analysis may not factor in the latest price-sensitive company announcements or qualitative material. Simply Wall St has no position in any stocks mentioned.
About SEHK:491
Emperor Culture Group
An investment holding company, engages in the entertainment, media, and cultural development businesses in the Mainland China, Hong Kong, Macau, and rest of Asia Pacific.
Low and slightly overvalued.
Market Insights

Advertisement
Community Narratives
The Most Undervalued of the Magnificent 7
Fair Value US$237.43|36.3% undervalued
IN
Community Contributor
PVA TePla's New Strategy Aims for 22% Revenue Growth in Semiconductor Recovery
Fair Value €19.19|20.8% undervalued
MI
Community Contributor