- Hong Kong
- /
- Metals and Mining
- /
- SEHK:826
Many Still Looking Away From Tiangong International Company Limited (HKG:826)


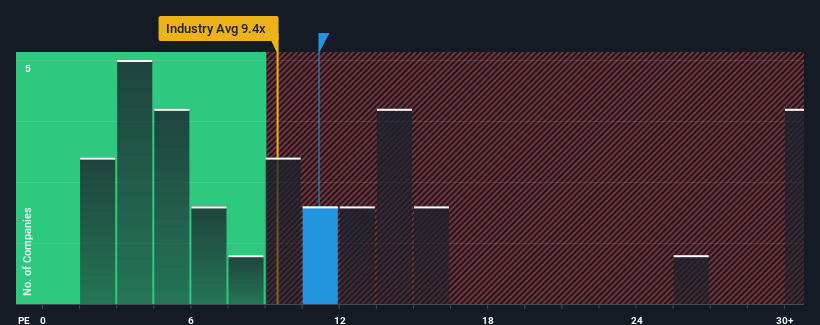
With a median price-to-earnings (or "P/E") ratio of close to 9x in Hong Kong, you could be forgiven for feeling indifferent about Tiangong International Company Limited's (HKG:826) P/E ratio of 11.1x. Although, it's not wise to simply ignore the P/E without explanation as investors may be disregarding a distinct opportunity or a costly mistake.
Recent times haven't been advantageous for Tiangong International as its earnings have been falling quicker than most other companies. It might be that many expect the dismal earnings performance to revert back to market averages soon, which has kept the P/E from falling. If you still like the company, you'd want its earnings trajectory to turn around before making any decisions. If not, then existing shareholders may be a little nervous about the viability of the share price.
View our latest analysis for Tiangong International
How Is Tiangong International's Growth Trending?
In order to justify its P/E ratio, Tiangong International would need to produce growth that's similar to the market.
Retrospectively, the last year delivered a frustrating 36% decrease to the company's bottom line. This means it has also seen a slide in earnings over the longer-term as EPS is down 14% in total over the last three years. Therefore, it's fair to say the earnings growth recently has been undesirable for the company.
Looking ahead now, EPS is anticipated to climb by 22% per annum during the coming three years according to the three analysts following the company. With the market only predicted to deliver 15% per annum, the company is positioned for a stronger earnings result.
In light of this, it's curious that Tiangong International's P/E sits in line with the majority of other companies. It may be that most investors aren't convinced the company can achieve future growth expectations.
The Key Takeaway
Typically, we'd caution against reading too much into price-to-earnings ratios when settling on investment decisions, though it can reveal plenty about what other market participants think about the company.
We've established that Tiangong International currently trades on a lower than expected P/E since its forecast growth is higher than the wider market. There could be some unobserved threats to earnings preventing the P/E ratio from matching the positive outlook. At least the risk of a price drop looks to be subdued, but investors seem to think future earnings could see some volatility.
A lot of potential risks can sit within a company's balance sheet. Our free balance sheet analysis for Tiangong International with six simple checks will allow you to discover any risks that could be an issue.
It's important to make sure you look for a great company, not just the first idea you come across. So take a peek at this free list of interesting companies with strong recent earnings growth (and a low P/E).
If you're looking to trade Tiangong International, open an account with the lowest-cost platform trusted by professionals, Interactive Brokers.
With clients in over 200 countries and territories, and access to 160 markets, IBKR lets you trade stocks, options, futures, forex, bonds and funds from a single integrated account.
Enjoy no hidden fees, no account minimums, and FX conversion rates as low as 0.03%, far better than what most brokers offer.
Sponsored ContentValuation is complex, but we're here to simplify it.
Discover if Tiangong International might be undervalued or overvalued with our detailed analysis, featuring fair value estimates, potential risks, dividends, insider trades, and its financial condition.
Access Free AnalysisHave feedback on this article? Concerned about the content? Get in touch with us directly. Alternatively, email editorial-team (at) simplywallst.com.
This article by Simply Wall St is general in nature. We provide commentary based on historical data and analyst forecasts only using an unbiased methodology and our articles are not intended to be financial advice. It does not constitute a recommendation to buy or sell any stock, and does not take account of your objectives, or your financial situation. We aim to bring you long-term focused analysis driven by fundamental data. Note that our analysis may not factor in the latest price-sensitive company announcements or qualitative material. Simply Wall St has no position in any stocks mentioned.
About SEHK:826
Tiangong International
Manufactures and sells alloy steel, cutting tools, titanium alloys, and related products in the People’s Republic of China, North America, Europe, other Asian countries, and internationally.
Excellent balance sheet and slightly overvalued.

