- Hong Kong
- /
- Metals and Mining
- /
- SEHK:2899
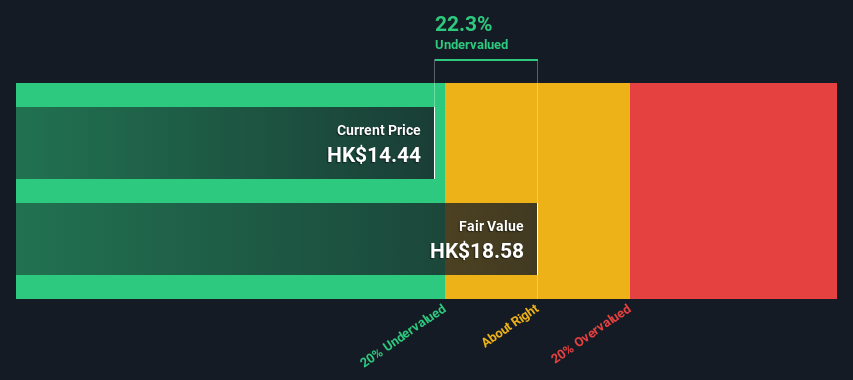
Are Investors Undervaluing Zijin Mining Group Company Limited (HKG:2899) By 22%?


Key Insights
- Zijin Mining Group's estimated fair value is HK$18.58 based on 2 Stage Free Cash Flow to Equity
- Current share price of HK$14.44 suggests Zijin Mining Group is potentially 22% undervalued
- Analyst price target for 2899 is CN¥15.96 which is 14% below our fair value estimate
In this article we are going to estimate the intrinsic value of Zijin Mining Group Company Limited (HKG:2899) by taking the forecast future cash flows of the company and discounting them back to today's value. One way to achieve this is by employing the Discounted Cash Flow (DCF) model. Before you think you won't be able to understand it, just read on! It's actually much less complex than you'd imagine.
Remember though, that there are many ways to estimate a company's value, and a DCF is just one method. Anyone interested in learning a bit more about intrinsic value should have a read of the Simply Wall St analysis model.
Check out our latest analysis for Zijin Mining Group
Is Zijin Mining Group Fairly Valued?
We're using the 2-stage growth model, which simply means we take in account two stages of company's growth. In the initial period the company may have a higher growth rate and the second stage is usually assumed to have a stable growth rate. To begin with, we have to get estimates of the next ten years of cash flows. Where possible we use analyst estimates, but when these aren't available we extrapolate the previous free cash flow (FCF) from the last estimate or reported value. We assume companies with shrinking free cash flow will slow their rate of shrinkage, and that companies with growing free cash flow will see their growth rate slow, over this period. We do this to reflect that growth tends to slow more in the early years than it does in later years.
Generally we assume that a dollar today is more valuable than a dollar in the future, and so the sum of these future cash flows is then discounted to today's value:
10-year free cash flow (FCF) forecast
| 2024 | 2025 | 2026 | 2027 | 2028 | 2029 | 2030 | 2031 | 2032 | 2033 | |
| Levered FCF (CN¥, Millions) | CN¥15.8b | CN¥21.8b | CN¥26.4b | CN¥30.5b | CN¥34.0b | CN¥37.0b | CN¥39.4b | CN¥41.5b | CN¥43.3b | CN¥44.8b |
| Growth Rate Estimate Source | Analyst x2 | Analyst x2 | Est @ 21.27% | Est @ 15.50% | Est @ 11.46% | Est @ 8.64% | Est @ 6.66% | Est @ 5.27% | Est @ 4.30% | Est @ 3.62% |
| Present Value (CN¥, Millions) Discounted @ 9.4% | CN¥14.4k | CN¥18.2k | CN¥20.2k | CN¥21.3k | CN¥21.7k | CN¥21.5k | CN¥21.0k | CN¥20.2k | CN¥19.2k | CN¥18.2k |
("Est" = FCF growth rate estimated by Simply Wall St)
Present Value of 10-year Cash Flow (PVCF) = CN¥196b
The second stage is also known as Terminal Value, this is the business's cash flow after the first stage. The Gordon Growth formula is used to calculate Terminal Value at a future annual growth rate equal to the 5-year average of the 10-year government bond yield of 2.0%. We discount the terminal cash flows to today's value at a cost of equity of 9.4%.
Terminal Value (TV)= FCF2033 × (1 + g) ÷ (r – g) = CN¥45b× (1 + 2.0%) ÷ (9.4%– 2.0%) = CN¥620b
Present Value of Terminal Value (PVTV)= TV / (1 + r)10= CN¥620b÷ ( 1 + 9.4%)10= CN¥252b
The total value, or equity value, is then the sum of the present value of the future cash flows, which in this case is CN¥448b. The last step is to then divide the equity value by the number of shares outstanding. Relative to the current share price of HK$14.4, the company appears a touch undervalued at a 22% discount to where the stock price trades currently. Remember though, that this is just an approximate valuation, and like any complex formula - garbage in, garbage out.
The Assumptions
We would point out that the most important inputs to a discounted cash flow are the discount rate and of course the actual cash flows. If you don't agree with these result, have a go at the calculation yourself and play with the assumptions. The DCF also does not consider the possible cyclicality of an industry, or a company's future capital requirements, so it does not give a full picture of a company's potential performance. Given that we are looking at Zijin Mining Group as potential shareholders, the cost of equity is used as the discount rate, rather than the cost of capital (or weighted average cost of capital, WACC) which accounts for debt. In this calculation we've used 9.4%, which is based on a levered beta of 1.311. Beta is a measure of a stock's volatility, compared to the market as a whole. We get our beta from the industry average beta of globally comparable companies, with an imposed limit between 0.8 and 2.0, which is a reasonable range for a stable business.
SWOT Analysis for Zijin Mining Group
- Debt is well covered by earnings and cashflows.
- Earnings declined over the past year.
- Dividend is low compared to the top 25% of dividend payers in the Metals and Mining market.
- Annual earnings are forecast to grow faster than the Hong Kong market.
- Trading below our estimate of fair value by more than 20%.
- Revenue is forecast to grow slower than 20% per year.
Looking Ahead:
Although the valuation of a company is important, it is only one of many factors that you need to assess for a company. DCF models are not the be-all and end-all of investment valuation. Rather it should be seen as a guide to "what assumptions need to be true for this stock to be under/overvalued?" For example, changes in the company's cost of equity or the risk free rate can significantly impact the valuation. Why is the intrinsic value higher than the current share price? For Zijin Mining Group, there are three further aspects you should further examine:
- Risks: As an example, we've found 1 warning sign for Zijin Mining Group that you need to consider before investing here.
- Future Earnings: How does 2899's growth rate compare to its peers and the wider market? Dig deeper into the analyst consensus number for the upcoming years by interacting with our free analyst growth expectation chart.
- Other Solid Businesses: Low debt, high returns on equity and good past performance are fundamental to a strong business. Why not explore our interactive list of stocks with solid business fundamentals to see if there are other companies you may not have considered!
PS. The Simply Wall St app conducts a discounted cash flow valuation for every stock on the SEHK every day. If you want to find the calculation for other stocks just search here.
Valuation is complex, but we're here to simplify it.
Discover if Zijin Mining Group might be undervalued or overvalued with our detailed analysis, featuring fair value estimates, potential risks, dividends, insider trades, and its financial condition.
Access Free AnalysisHave feedback on this article? Concerned about the content? Get in touch with us directly. Alternatively, email editorial-team (at) simplywallst.com.
This article by Simply Wall St is general in nature. We provide commentary based on historical data and analyst forecasts only using an unbiased methodology and our articles are not intended to be financial advice. It does not constitute a recommendation to buy or sell any stock, and does not take account of your objectives, or your financial situation. We aim to bring you long-term focused analysis driven by fundamental data. Note that our analysis may not factor in the latest price-sensitive company announcements or qualitative material. Simply Wall St has no position in any stocks mentioned.
About SEHK:2899
Zijin Mining Group
A mining company, engages in the exploration, mining, processing, refining, and sale of gold, non-ferrous metals, and other mineral resources in Mainland China and internationally.
Outstanding track record and undervalued.
Similar Companies
Market Insights

Community Narratives

